The chart below shows the amount of leisure time enjoyed by men and women of different employment status.
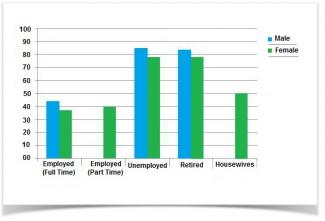
Given is the graph providing statistical information about the proportion of time spent on leisure activities by males and females with various employment levels between 1998 and 1999.
We can immediately see that, there were no figures for males who worked part-time and worked at home as housewives. It is also apparent that, the indicators of unemployed and retired were almost identical in both sexes.
According to the graph it can be noted that, employed full time females spent the minimum amount of time among the indicated groups and were slightly less than their male counterparts with ...
Subscribe as testbig VIP readers and get unlimited access to essays on the top list.

Attribute Value Ideal
Score: 8.0 out of 9
Category: Excellent Excellent
No. of Grammatical Errors: 0 2
No. of Spelling Errors: 0 2
No. of Sentences: 7 10
No. of Words: 174 200
No. of Characters: 881 1000
No. of Different Words: 102 100
Fourth Root of Number of Words: 3.632 4.0
Average Word Length: 5.063 4.6
Word Length SD: 2.644 2.4
No. of Words greater than 5 chars: 59 60
No. of Words greater than 6 chars: 50 50
No. of Words greater than 7 chars: 32 40
No. of Words greater than 8 chars: 23 20
Use of Passive Voice (%): 0 0
Avg. Sentence Length: 24.857 21.0
Sentence Length SD: 7.396 7.5
Use of Discourse Markers (%): 0.286 0.12
Sentence-Text Coherence: 0.478 0.35
Sentence-Para Coherence: 0.841 0.50
Sentence-Sentence Coherence: 0.111 0.07
Number of Paragraphs: 5 4