The chart below shows the total number of minutes (in billions) of telephone calls in the UK, divided into three categories, from 1995-2002.
Summarise the information by selecting and reporting the main features, and make a comparisons where relevant.
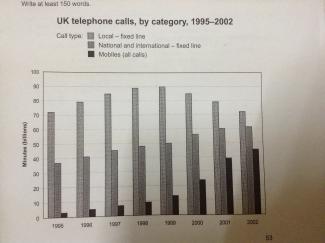
The provided graph illustrates the telephone usage statistic in three sections: local – fixed line, national and international – fixed line, and mobiles in the UK from 1995 to 2002. Overall, fixed line phone was more used minutes than mobiles phone throughout survey period.
The most favorite communication way was local– fixed line; it was used by the UK users over 70 billion minutes in 1995 and then it reached its highest point in 1999 at 90 billion minutes. After that, local– fixed line usage dropped steadily but it still was more used in UK than other types. Regarding the utilization of national and international– fixed line, it increased slightly from nearly 40 billion minutes in 1995 to 60 billion minutes in 2002.
Turning to consider about mobile phone, its amount of usage climbed slowly from lower 10 billion minutes in 1995 to just over 10 billion in 1999. But, There was a dramatic growth in mobiles usage, about fourtimes within three years, with almost 50 billion minutes in 2002.

fixed line phone was more used minutes than mobiles phone throughout survey period.
fixed line phone has more used minutes than mobiles phone throughout survey period.
better to have 4 paragraphs:
para 1: introduction
para 2: body 1
para 3: body 2
para 4: conclusion
sample:
http://www.testbig.com/ielts-essays/qthe-graph-below-shows-different-mo…
http://www.testbig.com/ielts-essays/graph-below-gives-information-about…
http://www.testbig.com/ielts-essays/charts-below-show-uk-and-usa-energy…
http://www.testbig.com/ielts-essays/cheart-below-shows-information-abou…
or
para 1: introduction
para 2: conclusion
para 3: body 1
para 4: body 2
sample:
http://www.testbig.com/ielts-essays/climograph-below-shows-average-mont…
http://www.testbig.com/ielts-essays/graphs-below-show-types-music-album…
http://www.testbig.com/ielts-essays/table-below-gives-information-about…
Attribute Value Ideal
Score: 6.0 out of 9
Category: Good Excellent
No. of Grammatical Errors: 0 2
No. of Spelling Errors: 0 2
No. of Sentences: 7 10
No. of Words: 168 200
No. of Characters: 808 1000
No. of Different Words: 88 100
Fourth Root of Number of Words: 3.6 4.0
Average Word Length: 4.81 4.6
Word Length SD: 2.403 2.4
No. of Words greater than 5 chars: 52 60
No. of Words greater than 6 chars: 43 50
No. of Words greater than 7 chars: 20 40
No. of Words greater than 8 chars: 11 20
Use of Passive Voice (%): 0 0
Avg. Sentence Length: 24 21.0
Sentence Length SD: 6.279 7.5
Use of Discourse Markers (%): 0.571 0.12
Sentence-Text Coherence: 0.548 0.35
Sentence-Para Coherence: 0.728 0.50
Sentence-Sentence Coherence: 0.189 0.07
Number of Paragraphs: 3 4