The pie chart below shows the main reasons why agricultural land becomes less productive. The table shows how these causes affected three regions of the world during the 1990s.
Summarize the information by selecting and reporting the main features, and make comparisons where relevant.
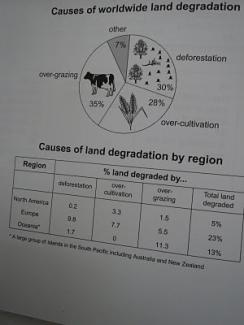
The table illustrates reasons why fertile land became less productive in three vary regions during 1990s based on the main causes of degradation in all over the world. It can be seen from the pie chart that the major factors which affect productive land is; over-grazing, deforestation and over-cultivation, 35, 30 and 28 percent respectively.
In Europe total land degradation was higher than other two regions, 23 percent. Deforestation was essential reason which declined productivity in Europe during 1990s, about 10 percent. Europe also exceeds North America and Oceania for over-cultivated land, 7.7 percent. The second region due to causes of total land degradation was Oceania, 13 percent. Over-grazing took the first place which made agricultural land less fertile, about 11 percent. It seems that land in Oceania have not been over cultivated at all.
In contrast to Europe and Oceania, land degradation was less in North America, five percent. Over-cultivation was core reason which caused to land degradation in North America in 1990s, 3.3 percent.

Attribute Value Ideal
Score: 7.0 out of 9
Category: Good Excellent
No. of Grammatical Errors: 0 2
No. of Spelling Errors: 0 2
No. of Sentences: 10 10
No. of Words: 166 200
No. of Characters: 871 1000
No. of Different Words: 96 100
Fourth Root of Number of Words: 3.589 4.0
Average Word Length: 5.247 4.6
Word Length SD: 3.019 2.4
No. of Words greater than 5 chars: 60 60
No. of Words greater than 6 chars: 44 50
No. of Words greater than 7 chars: 22 40
No. of Words greater than 8 chars: 20 20
Use of Passive Voice (%): 0 0
Avg. Sentence Length: 16.6 21.0
Sentence Length SD: 5.553 7.5
Use of Discourse Markers (%): 0.4 0.12
Sentence-Text Coherence: 0.495 0.35
Sentence-Para Coherence: 0.633 0.50
Sentence-Sentence Coherence: 0.153 0.07
Number of Paragraphs: 3 4