The bar chart below shows the estimated percentage of car trips taken by drivers in 2005
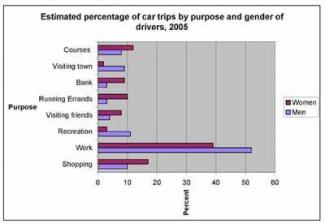
The chart illustrates the approximate percentage of reasons for taking a car trip by aim and sex of drivers in 2005.
It is evident from the graph that the number of women using cars exceeded that of man in the given period and the purpose with the most significant difference between genders was work. Work was also the most popular goal for all women and man. Furthermore, both males and females least preferred taking cars for visiting friends.
There were five causes in which women needed cars more than men. While approximately 10 percentage of women went to bank and running errands, the ...
Subscribe as testbig VIP readers and get unlimited access to essays on the top list.

Attribute Value Ideal
Score: 7.5 out of 9
Category: Very Good Excellent
No. of Grammatical Errors: 0 2
No. of Spelling Errors: 0 2
No. of Sentences: 9 10
No. of Words: 198 200
No. of Characters: 931 1000
No. of Different Words: 115 100
Fourth Root of Number of Words: 3.751 4.0
Average Word Length: 4.702 4.6
Word Length SD: 2.677 2.4
No. of Words greater than 5 chars: 56 60
No. of Words greater than 6 chars: 45 50
No. of Words greater than 7 chars: 26 40
No. of Words greater than 8 chars: 20 20
Use of Passive Voice (%): 0 0
Avg. Sentence Length: 22 21.0
Sentence Length SD: 9.911 7.5
Use of Discourse Markers (%): 0.556 0.12
Sentence-Text Coherence: 0.421 0.35
Sentence-Para Coherence: 0.698 0.50
Sentence-Sentence Coherence: 0.095 0.07
Number of Paragraphs: 4 4