The bar chart below shows the highest qualification attained by sex for the working age population in Wales in 2001/2002.
Summarize the information by selecting and reporting the main features, and make comparisons where relevant.
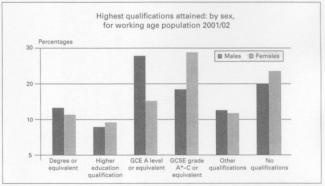
The bar chart describes the highest qualification that working age men and women had in Wales in 2001/2002.
From the given illustration, the percentage of the male and female with a degree or equivalent qualification is the same with the proportion of the same sex categories having other qualifications. The percentages ate almost 13% for men and 12% for women for both categories.
The minor minority of the population described in the table has a higher education qualification (less than 10% for both women and men). Furthermore, the vast majority of the people having a GCE A level are men ...
Subscribe as testbig VIP readers and get unlimited access to essays on the top list.

Sentence: Furthermore, the vast majority of the people having a GCE A level are men 30, whereas the proportion of women with tha same qualifications accounts only 15.
Error: tha Suggestion: the
Sentence: To conclude, more men, have a GCE A level qualifications, while the majority of women have a GCSE grade A to C. For the other four categories depicted in the chart, there is no signifficant difference between males and females.
Error: signifficant Suggestion: significant
Attribute Value Ideal
Score: 8.0 out of 9
Category: Excellent Excellent
No. of Grammatical Errors: 0 2
No. of Spelling Errors: 2 2
No. of Sentences: 8 10
No. of Words: 194 200
No. of Characters: 920 1000
No. of Different Words: 100 100
Fourth Root of Number of Words: 3.732 4.0
Average Word Length: 4.742 4.6
Word Length SD: 3.134 2.4
No. of Words greater than 5 chars: 51 60
No. of Words greater than 6 chars: 41 50
No. of Words greater than 7 chars: 35 40
No. of Words greater than 8 chars: 27 20
Use of Passive Voice (%): 0 0
Avg. Sentence Length: 24.25 21.0
Sentence Length SD: 8.242 7.5
Use of Discourse Markers (%): 0.375 0.12
Sentence-Text Coherence: 0.47 0.35
Sentence-Para Coherence: 0.711 0.50
Sentence-Sentence Coherence: 0.09 0.07
Number of Paragraphs: 4 4