The bat chart below gives information about vehicle ownership in China.
Write a report for a university lecturer describing the information.
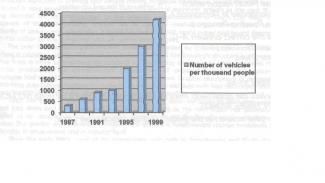
The bar chart provides the information about the vehicle ownership for a period of 12 years between 1987 and 1999.
If we look at the graph, we can clearly see that, vehicle ownership has increased substantially over the 12 years between 1987 and 1999. In 1987, the number of vehicles per thousand people in china was extremely low with just 250, but after then it increased gradually and reached around 900 in 1991. Between 1991 and 1993, the increase in vehicle ownership was just marginal with around 100. However, from 1993 on-wards, the trend of vehicle ownership soared up unexpectedly and reached dramatic figures of 2000 in 1995, 3000 in 1997 and over 4000 in 1999.
In overall, it can be deduced from the graph that the popularity of vehicle ownership in china is phenomenal in the latest years, although it was not so remarkable in the early years between 1987 and 1993.

Comments
The essay is quite short due
The essay is quite short due to the limited content of the graph. I didn't find anything more to write about this graph.
It is OK for this one. This
It is OK for this one. This is just an alert.
flaws:
No. of Words: 153 200
Attribute Value Ideal
Score: 7.0 out of 9
Category: Good Excellent
No. of Grammatical Errors: 0 2
No. of Spelling Errors: 0 2
No. of Sentences: 6 10
No. of Words: 153 200
No. of Characters: 710 1000
No. of Different Words: 86 100
Fourth Root of Number of Words: 3.517 4.0
Average Word Length: 4.641 4.6
Word Length SD: 2.475 2.4
No. of Words greater than 5 chars: 46 60
No. of Words greater than 6 chars: 39 50
No. of Words greater than 7 chars: 23 40
No. of Words greater than 8 chars: 15 20
Use of Passive Voice (%): 0 0
Avg. Sentence Length: 25.5 21.0
Sentence Length SD: 6.994 7.5
Use of Discourse Markers (%): 0.667 0.12
Sentence-Text Coherence: 0.517 0.35
Sentence-Para Coherence: 0.708 0.50
Sentence-Sentence Coherence: 0.184 0.07
Number of Paragraphs: 3 4