The chart below gives information on the percentage of British people giving money to charity by age range for the years 1990 and 2010.
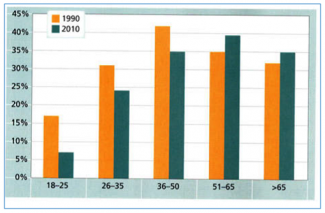
Given is the bar chart which illustrates the percentages of donations to charity by British citizens in different aged groups in years 1990 and 2010.
Overall, across the two years, the patterns were different as the level of donation in British citizens in 1990 was higher than in 2010, except in among the 51- 65 and over 65 age groups. There were also smaller differences in the donations between the two years in the 51-65 age group, compared to younger groups.
The first thing to mention is that in 1990 most people who are younger than 50 years old contributed money to charity more than in 2010. In detail, the 18-25 s, the 26-35 s and the 36-50s donated 18%, 32% and 43% in 1990, however in the next ten years the statistics dropped by 10%, 7% and 8% respectively. In contrast, the patterns of two age groups: 51-65 years and older than 65 age group differ from other age groups as the levels of donation increased from 35% to 40% and 33% to 35%, respectively.
Secondly, the 18-25s contributed to charity the least. The rate of contribution was not higher than 17% which was three times lower than the 36-50s group. Apparently, the highest donation rate was in population aged 36- 50 as the figure was up to 43% in 1990. Lastly, there were around 5 percent differences in the charitable donations of the 51-65 years and over groups, which were less than the differences in other groups.

the level of donation in British citizens in 1990 was higher than in 2010
the level of donation in British citizens in 1990 was higher than that (the level) in 2010
except in among the 51- 65 and over 65 age groups.
except in the 51- 65 and over 65 age groups.
Attribute Value Ideal
Score: 6.5 out of 9
Category: Good Excellent
No. of Grammatical Errors: 2 2
No. of Spelling Errors: 0 2
No. of Sentences: 10 10
No. of Words: 249 200
No. of Characters: 1105 1000
No. of Different Words: 115 100
Fourth Root of Number of Words: 3.972 4.0
Average Word Length: 4.438 4.6
Word Length SD: 2.478 2.4
No. of Words greater than 5 chars: 67 60
No. of Words greater than 6 chars: 46 50
No. of Words greater than 7 chars: 30 40
No. of Words greater than 8 chars: 20 20
Use of Passive Voice (%): 0 0
Avg. Sentence Length: 24.9 21.0
Sentence Length SD: 8.179 7.5
Use of Discourse Markers (%): 0.7 0.12
Sentence-Text Coherence: 0.426 0.35
Sentence-Para Coherence: 0.635 0.50
Sentence-Sentence Coherence: 0.066 0.07
Number of Paragraphs: 4 4