The chart below shows the amount of leisure time enjoyed by men and women of different employment status
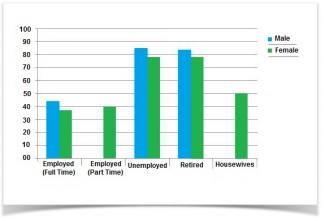
Given are the two bar graphs represent the statistical information of leisure time spent in typical week by two genders with different levels of employment between 1998 to 1999.
One can immediately notice that there were only three employment levels for males, while there were five various employments types for females. According to the bar graphs, unemployment and retired for both sexes have the highest number of leisure time spent. With males at 90 hours and females at 80 hours. On the other hand, the males and females for full time employment have almost 50% less leisure time compared with the unemployed and retirees.Which was 45 hours for males and 40 hours for females. As regards, to the two remaining employment statuses for females, the part time employees and housewives have 40 and 50 hours of leisure time during a typical week.
As indicated by these bar graph, one can see that the total number of females had more leisure time than males in a typical week from 1998 to 1999.

Attribute Value Ideal
Score: 7.0 out of 9
Category: Good Excellent
No. of Grammatical Errors: 0 2
No. of Spelling Errors: 0 2
No. of Sentences: 7 10
No. of Words: 172 200
No. of Characters: 810 1000
No. of Different Words: 90 100
Fourth Root of Number of Words: 3.621 4.0
Average Word Length: 4.709 4.6
Word Length SD: 2.391 2.4
No. of Words greater than 5 chars: 49 60
No. of Words greater than 6 chars: 40 50
No. of Words greater than 7 chars: 20 40
No. of Words greater than 8 chars: 17 20
Use of Passive Voice (%): 0 0
Avg. Sentence Length: 24.571 21.0
Sentence Length SD: 7.651 7.5
Use of Discourse Markers (%): 0.429 0.12
Sentence-Text Coherence: 0.51 0.35
Sentence-Para Coherence: 0.68 0.50
Sentence-Sentence Coherence: 0.147 0.07
Number of Paragraphs: 3 4