The chart below shows the amount of money per week spent on fast foods in Britain. The graph shows the trends in consumption of fast foods. Write a report for university lecturer describing the information shown below.
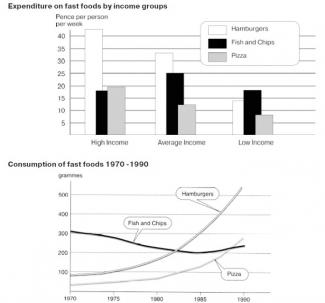
The bar chart depicts the changes in weekly spending by Britons on three types of fast food : Hamburgers, Fish & Chips and Pizza, while the line graph presents the fast-food consumption between 1970 and 1990.
Generally, Hamburgers, which are roughly large percentage of expenditure compared to the Pizza and Fish & Chips, are the most favorable food in Britain.
Turning to the first graph, high-income people are more likely to consume Hamburgers which were approximately two times popular than Pizza and Fish & Chips, presented over forty-two pence per week. Then, average-income people also consume Hamburgers, while they ate more Fish & Chips compared to previous figure, rising approximately 8 percent of expenditure. The low-income Pizza’s expenditure was more twice smaller than Fish & Chips which were slightly larger than Hamburgers in almost pence per week.
Next, the line graph describes Hamburgers and Pizza rose steadily between 1970 and 1980, while Fish and Chips declined slightly from 300 to nearly 200 grammes. From 1985, Hamburgers and Fish & Chips rose steadily throughout the year, where Hamburger had over twice as high as Pizza recording 270 grammes.
Overall, in the earliest 20th century, the most of Britons consume Hamburger as their preferable fast food.

Pizza’s expenditure was more twice smaller than Fish & Chips
Pizza’s expenditure was twice smaller than Fish & Chips
the line graph describes Hamburgers and Pizza rose steadily between 1970 and 1980
the line graph describes Hamburgers and Pizza which rose steadily between 1970 and 1980
flaws:
Sentence Length SD: 4.948 7.5
Attribute Value Ideal
Score: 7.0 out of 9
Category: Good Excellent
No. of Grammatical Errors: 2 2
No. of Spelling Errors: 0 2
No. of Sentences: 8 10
No. of Words: 197 200
No. of Characters: 1045 1000
No. of Different Words: 108 100
Fourth Root of Number of Words: 3.746 4.0
Average Word Length: 5.305 4.6
Word Length SD: 2.6 2.4
No. of Words greater than 5 chars: 68 60
No. of Words greater than 6 chars: 59 50
No. of Words greater than 7 chars: 39 40
No. of Words greater than 8 chars: 28 20
Use of Passive Voice (%): 0 0
Avg. Sentence Length: 24.625 21.0
Sentence Length SD: 4.948 7.5
Use of Discourse Markers (%): 0.5 0.12
Sentence-Text Coherence: 0.514 0.35
Sentence-Para Coherence: 0.848 0.50
Sentence-Sentence Coherence: 0.201 0.07
Number of Paragraphs: 5 4