The chart below shows information about changes in average house prices in five different cities between 1990 and 2002 compared with the average house prices in 1989.
Summarise the information by selecting and reporting the main features, and make comparisons where relevant.
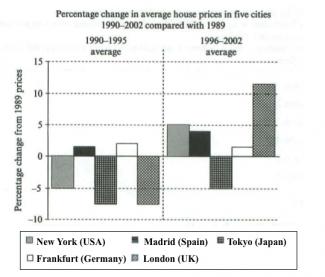
The particular vertical bar chart illustrates the data concerning about the changes in average house prices in five different cities during 12 years to compare with the average house prices in 1989.
According to the chart one of the first thing to note in the former is that although in the initial years ( between 1990 and 1995 ) almost all the cities suffered from great decline except Madrid and Frankfurt moving on to the last years ( 1996 and 2002 ) every city increased only apart from Tokyo.
From the first glance at the figures it turns out to be that Madrid rised rapidly to compare with the last five years whereas Frankfurt expresses the slight decline (Madrid: about 1 % between 1990 and 1995, approximately 4 % between 1996 - 2002).
The column New York decreased by five percent in the begining of the years and increased the same number as before reaching to the end of the years while Tokyo and London have a tendency of the same percentages in the initial years ( Tokyo and London between 1990 and 1995 it was 5.5 % ).
Overall by way of conclusion it can be clearly inferred from the chart that although the column London equal to the column Tokyo during first typical years, in the second part of the years London increased dramatically and became the highest of all whilst Tokyo continued decreasing by the same number like column America.

Sentence: The column New York decreased by five percent in the begining of the years and increased the same number as before reaching to the end of the years while Tokyo and London have a tendency of the same percentages in the initial years Tokyo and London between 1990 and 1995 it was 5.5 .
Error: begining Suggestion: beginning
flaws:
The second and the third paragraph are duplicated.
----------------------
Attribute Value Ideal
Score: 6.0 out of 9
Category: Satisfactory Excellent
No. of Grammatical Errors: 0 2
No. of Spelling Errors: 1 2
No. of Sentences: 5 10
No. of Words: 233 200
No. of Characters: 1095 1000
No. of Different Words: 115 100
Fourth Root of Number of Words: 3.907 4.0
Average Word Length: 4.7 4.6
Word Length SD: 2.285 2.4
No. of Words greater than 5 chars: 77 60
No. of Words greater than 6 chars: 48 50
No. of Words greater than 7 chars: 26 40
No. of Words greater than 8 chars: 18 20
Use of Passive Voice (%): 0 0
Avg. Sentence Length: 46.6 21.0
Sentence Length SD: 8.732 7.5
Use of Discourse Markers (%): 0.8 0.12
Sentence-Text Coherence: 0.583 0.35
Sentence-Para Coherence: 1 0.50
Sentence-Sentence Coherence: 0.226 0.07
Number of Paragraphs: 5 4