The chart below shows information about changes in average house prices in five different cities between 1990 and 2002 compared with average house prices in 1989. Summarize the information by selecting and reporting the main features, and make comparisons where relevant.
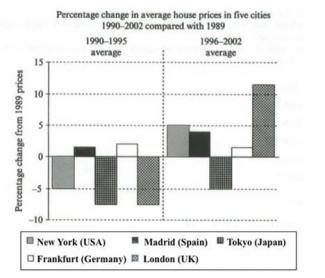
The given bar graph illustrates the percentage change in average houses prices in five different cities such as New York, Madrid, Tokyo, Frankfurt and London from 1990 to 2002 and compared with the average prices of houses in the year of 1989.
To begin with, it is vivid that the average price of houses in Tokyo and London were more plunged by almost 7% in both cities in contrast to other cities during 1990 to 1995. In New York, the price of house was also declined by 5% between 1990 to 1995 as compared to 1989. However, there was slightly hiked in the price of house by approximately 2% and 3% in Madrid and Frankfurt respectively during first phase of the period.
Additionally, the average prices of house were enhanced by around 5% and 4% in New York and Madrid Respectively during the period of 1996 to 2002 in contrast to 1989. In Tokyo, it was slightly slumped and reached at -5% between 1996 to 2002. Moreover, we can see that there was a little bit decreased in Frankfurt during second phase likening first phase of the period. Though, in London, the percentage of average price was reached at approximately 12% during last five year of said period, which was too high as compared to other cities.
Laconically, it is crystallized that most of the individuals preferred to live in London and New York that’s why the average price of habitations reached at lofty during aforesaid period in contrast to 1989.

Sentence: The given bar graph illustrates the percentage change in average houses prices in five different cities such as New York, Madrid, Tokyo, Frankfurt and London from 1990 to 2002 and compared with the average prices of houses in the year of 1989.
Description: A noun, plural, common is not usually followed by a noun, plural, common
Suggestion: Refer to houses and prices
during second phase
during the second phase
flaws:
No. of Words: 251 200
Write the essay in 20 minutes.
Attribute Value Ideal
Score: 7.0 out of 9
Category: Good Excellent
No. of Grammatical Errors: 2 2
No. of Spelling Errors: 0 2
No. of Sentences: 9 10
No. of Words: 251 200
No. of Characters: 1137 1000
No. of Different Words: 106 100
Fourth Root of Number of Words: 3.98 4.0
Average Word Length: 4.53 4.6
Word Length SD: 2.539 2.4
No. of Words greater than 5 chars: 80 60
No. of Words greater than 6 chars: 45 50
No. of Words greater than 7 chars: 31 40
No. of Words greater than 8 chars: 19 20
Use of Passive Voice (%): 0 0
Avg. Sentence Length: 27.889 21.0
Sentence Length SD: 7.978 7.5
Use of Discourse Markers (%): 0.778 0.12
Sentence-Text Coherence: 0.476 0.35
Sentence-Para Coherence: 0.683 0.50
Sentence-Sentence Coherence: 0.179 0.07
Number of Paragraphs: 4 4