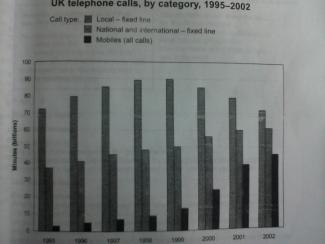
The chart below shows the total number of minutes of telephone calls in the UK, divided into three categories, from 1995-2002.
Given is a chart indicating the amount of time people spent on three categories of telephone call in the US from 1995 to 2002.
As can be seen, local fixed line was by far the most prevalent category in the UK. The number of minutes of local-fixed line was over 70 billion in 1995 which doubled that of national and international-fixed line. Mobile was the least popular category in the UK, with only 3 billion minutes in 1995. The gap between 3 categories was highest in 1999. The amount of time spent on local-fixed line and national and international-fixed line was approximately 90 and 50 billi...
Subscribe as testbig VIP readers and get unlimited access to essays on the top list.

Attribute Value Ideal
Score: 8.0 out of 9
Category: Excellent Excellent
No. of Grammatical Errors: 0 2
No. of Spelling Errors: 0 2
No. of Sentences: 11 10
No. of Words: 210 200
No. of Characters: 977 1000
No. of Different Words: 96 100
Fourth Root of Number of Words: 3.807 4.0
Average Word Length: 4.652 4.6
Word Length SD: 3.086 2.4
No. of Words greater than 5 chars: 61 60
No. of Words greater than 6 chars: 53 50
No. of Words greater than 7 chars: 31 40
No. of Words greater than 8 chars: 21 20
Use of Passive Voice (%): 0 0
Avg. Sentence Length: 19.091 21.0
Sentence Length SD: 5.992 7.5
Use of Discourse Markers (%): 0.182 0.12
Sentence-Text Coherence: 0.448 0.35
Sentence-Para Coherence: 0.623 0.50
Sentence-Sentence Coherence: 0.104 0.07
Number of Paragraphs: 4 4