Essay topics:
The chart shows components of GDP in the UK from 1992 to 2000.
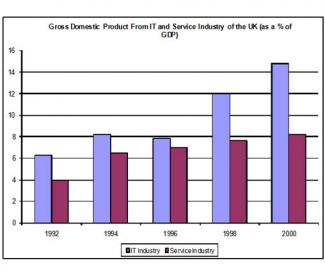
The bar chart illustrates the gross domestic product generated from the IT and Service Industry in the UK from 1992 to 2000. It is measured in percentages. Overall, it can be seen that both increased as a percentage of GDP, but IT remained at a higher rate throughout this time.
At the beginning of the period, in 1992, the Service Industry accounted for 4 per cent of GDP, whereas IT exceeded this, at just over 6 per cent. Over the next four years, the levels became more similar, with both components standing between 6 and just over 8 per cent. IT was still higher overall, though it dropped s...
Subscribe as testbig VIP readers and get unlimited access to essays on the top list.
Votes

Attribute Value Ideal
Score: 8.0 out of 9
Category: Excellent Excellent
No. of Grammatical Errors: 2 2
No. of Spelling Errors: 0 2
No. of Sentences: 7 10
No. of Words: 181 200
No. of Characters: 803 1000
No. of Different Words: 100 100
Fourth Root of Number of Words: 3.668 4.0
Average Word Length: 4.436 4.6
Word Length SD: 2.484 2.4
No. of Words greater than 5 chars: 52 60
No. of Words greater than 6 chars: 41 50
No. of Words greater than 7 chars: 28 40
No. of Words greater than 8 chars: 17 20
Use of Passive Voice (%): 0 0
Avg. Sentence Length: 25.857 21.0
Sentence Length SD: 17.075 7.5
Use of Discourse Markers (%): 0.571 0.12
Sentence-Text Coherence: 0.445 0.35
Sentence-Para Coherence: 0.715 0.50
Sentence-Sentence Coherence: 0.099 0.07
Number of Paragraphs: 4 4