The charts show the world traffic volume measured in passenger-kilometer-miles.
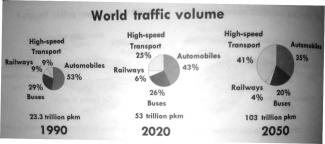

The pie charts demonstrate the volume of traffic in different forms in every thirty years from 1990 to 2050 (which has been measured in passenger-kilometer-miles).
It can be seen that the volume of traffic in 1990 was about 23.3 trillion pkm and it is prophesied that this amount will reach to 53 and 103 trillion pkm in 2020 and 2050 respectively.
To be more specific, the proportion of buses in traffic was 29% in 1990 and according to predictions this figure will decline to 26% and 20% in 2020 and 2050 respectively. Moving to automobiles, in 1990 its proportion was 53% and it is prognosticated that this amount will stand at 43% and 35% in 2020 and 2050. Also, railways represented 9% in 1990 and after 30 years this percent will decrease to 6% and in 2050, it will fall to 4%. However, projections have shown that the proportion of high-speed transport will have a upward trend from 9% in 1990 to 25% and 41% in every further 30 years.
In conclusion, unlike to high-speed transport, the proportion of other vehicles in traffic volume will have a downward trend until middle of the twenty-one century.

flaws:
Sentence Length SD: 3.98 7.5
"Sentence Length SD is low" means that the essay contains lots of sentences with the similar length. More sentences varieties wanted.
Try not repeat words, phrases and sentences. like: 'respectively'
Attribute Value Ideal
Score: 6.5 out of 9
Category: Good Excellent
No. of Grammatical Errors: 0 2
No. of Spelling Errors: 0 2
No. of Sentences: 7 10
No. of Words: 195 200
No. of Characters: 885 1000
No. of Different Words: 98 100
Fourth Root of Number of Words: 3.737 4.0
Average Word Length: 4.538 4.6
Word Length SD: 3.077 2.4
No. of Words greater than 5 chars: 51 60
No. of Words greater than 6 chars: 39 50
No. of Words greater than 7 chars: 30 40
No. of Words greater than 8 chars: 22 20
Use of Passive Voice (%): 0 0
Avg. Sentence Length: 27.857 21.0
Sentence Length SD: 3.98 7.5
Use of Discourse Markers (%): 0.429 0.12
Sentence-Text Coherence: 0.497 0.35
Sentence-Para Coherence: 0.764 0.50
Sentence-Sentence Coherence: 0.19 0.07
Number of Paragraphs: 4 4