The graph and table below give information about water use worldwide and water consumption in two different countries. Summarise the information by selecting and reporting the main features, and make comparisons where relevant.
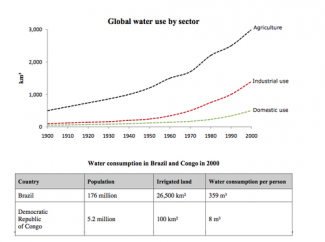
The graph elucidates the global water usages measured in km3 by three different sectors (agriculture, industrial, domestic) from 1900 and 2000 while the table illustrates the water usage in Brazil and Congo in 2000.
Overall, the consumption on global water has showed a positive trend. A majority of water usage was for agriculture purposes. From 1900, about the same water had used for industry and domestic purposes. The gap has widened since 1960 and it got widen by 2000. The water consumption on water remained fairly unchanged for the given projected period.
At the beginning of the projected period, the water consumption for the agriculture was below 1000 km3 whereas two other sectors showed almost 0 km3 on water usage. The agricultural water usage increased slightly at approximately 1,500km3 in next 60 years, and then it rose to more than 2,000km3 in 1970. There was a significant increase in the consumption of global water between 1970 and 2000 where the agricultural usage reached above 3,000km3. Meanwhile, during the 60 years, the industrial and residential used for water remained fairly unchanged. From 1960s, the water consumed for industries increased slightly to widen the gap of domestic usage on water. By 2000, the water used by industries has reached over 1000 km3.
The water used in Irrigated land in Brazil was 26,500 km2 with the population of 176 million while Congo used in irrigated land in 2000 was 100km2 with the population of 5.2 million. Thus, the water consumption per person for Brazil was 359 m3 whereas Democratic Republic of Congo was 8 m3 per person.

while Congo used in irrigated land in 2000 was 100km2 with the population of 5.2 million.
Description: can you re-write this sentence?
Sentence: The graph elucidates the global water usages measured in km3 by three different sectors agriculture, industrial, domestic from 1900 and 2000 while the table illustrates the water usage in Brazil and Congo in 2000.
Error: km3 Suggestion: my
flaws:
No. of Words: 267 200
Write the essay in 20 minutes.
Attribute Value Ideal
Score: 7.0 out of 9
Category: Good Excellent
No. of Grammatical Errors: 1 2
No. of Spelling Errors: 0 2
No. of Sentences: 14 10
No. of Words: 267 200
No. of Characters: 1304 1000
No. of Different Words: 120 100
Fourth Root of Number of Words: 4.042 4.0
Average Word Length: 4.884 4.6
Word Length SD: 2.62 2.4
No. of Words greater than 5 chars: 79 60
No. of Words greater than 6 chars: 60 50
No. of Words greater than 7 chars: 49 40
No. of Words greater than 8 chars: 33 20
Use of Passive Voice (%): 0 0
Avg. Sentence Length: 19.071 21.0
Sentence Length SD: 8.058 7.5
Use of Discourse Markers (%): 0.357 0.12
Sentence-Text Coherence: 0.419 0.35
Sentence-Para Coherence: 0.585 0.50
Sentence-Sentence Coherence: 0.127 0.07
Number of Paragraphs: 4 4