The graph below gives information from a 2008 report about consumption of energy in the USA since 1980 with projectins until 2030.
Summarize the information by selecting and reporting the main features and make comparisons where relevant.
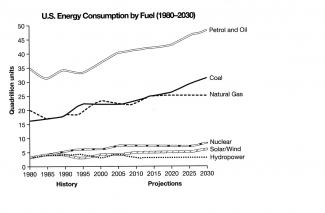
The line graph gives the information about the consumption of energy by various fuels in U.S since 1980 with projections until 2030.
Petrel and Oil have been highly used fuels since 1980 and is also expected to dominate till 2030 with even further rise. In 1980, around 35 quadrillion units of petrol and oil were used as fuel in US and afterwards continued to rise steadily with some slight fluctuations and is expected to reach around 50 quadrillion units in 2030.
It can be seen from the graph that natural gas was the second highest fuel consumed in US in 1980 with 20 quadrillion...
Subscribe as testbig VIP readers and get unlimited access to essays on the top list.

Attribute Value Ideal
Score: 7.5 out of 9
Category: Very Good Excellent
No. of Grammatical Errors: 0 2
No. of Spelling Errors: 0 2
No. of Sentences: 9 10
No. of Words: 235 200
No. of Characters: 1110 1000
No. of Different Words: 120 100
Fourth Root of Number of Words: 3.915 4.0
Average Word Length: 4.723 4.6
Word Length SD: 2.7 2.4
No. of Words greater than 5 chars: 65 60
No. of Words greater than 6 chars: 49 50
No. of Words greater than 7 chars: 36 40
No. of Words greater than 8 chars: 24 20
Use of Passive Voice (%): 0 0
Avg. Sentence Length: 26.111 21.0
Sentence Length SD: 5.858 7.5
Use of Discourse Markers (%): 0.333 0.12
Sentence-Text Coherence: 0.46 0.35
Sentence-Para Coherence: 0.716 0.50
Sentence-Sentence Coherence: 0.238 0.07
Number of Paragraphs: 4 4