The graph below gives the information from 2008 report about the consumption of energy in the USA since 1980 with projections until 2030.
Summarise the information by selecting and reporting the main features, and make comparisons where relevant.( taken from Cambridge IELTS book 9, test 4)
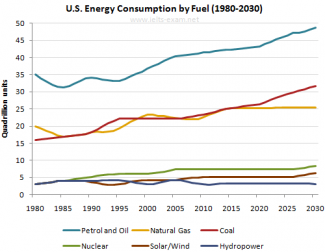
The line graph shows use of various forms of energy, as a fuel, between 1980 to 2030 in the USA.
Overall, there is an upward trend seen majority of the variants of which petrol and oil were most popular in all the years, however, a decline is observed in the utilization of hydropower as a fuel.
Between 1980 to 1995, fluctuation is noticed in the use of petrol, oil and coal, however, decreasing figures of former, from 35 quadrillion units to 33 quadrillion units are seen in this fifteen year duration, whereas increase of 6 quadrillion units for later entity was noted in same duration, rising from 16 to 22 quadrillion units. In the next few years there was a gradual increase in the consumption of both fuels and by the year 2030 it is expected that the use of petrol and oil will increase by 10 quadrillion units(around 45 quadrillion units) and that of coal will double to just over 30 quadrillion units. Usage of natural gas fluctuated wildly and then levelled off by the year 2014 with a difference of just three quadrillion units in its consumption over a period of 50 years.
Nuclear and solar/wind energy were less popular forms of fuels used, they saw a slight rise of about 5 and 2 quadrillion units respectively during this period, however, fluctuating trend of hydropower was seen, with its use being same in 1980 and 2030, around 4 quadrillion units.

Comments
can u please tell me how to
can u please tell me how to write a good task with fewer words
It is OK to put more words if
It is OK to put more words if you can finish the the essay on time. There is no penalty.
but I need a band of 7 or
but I need a band of 7 or plus for my writing task and I am going to appear on this Saturday, can you please give me some guidance to improve on it.
Follow those two suggestions
Follow those two suggestions to get 7.0 or over:
1. You still have grammar issues, but not big. So don't put a lot of content but leave about 3-5 minutes to check out grammatical issues.
2. don't develop a very long sentence. like this one:
'Between 1980 to 1995, fluctuation is noticed in the use of petrol, oil and coal, however, decreasing figures of former, from 35 quadrillion units to 33 quadrillion units are seen in this fifteen year duration, whereas increase of 6 quadrillion units for later entity was noted in same duration, rising from 16 to 22 quadrillion units. '
search online and read some articles for how to use punctuation marks.
The line graph shows use of various forms of energy
The line graph shows the use of various forms of energy
there is an upward trend seen majority of the variants of which petrol and oil were most popular in all the years,
Description: can you re-write this sentence?
in same duration
in the same duration
flaws:
Avg. Sentence Length: 40.5 21.0
No. of Words: 243 200
Write the essay in 20 minutes.
Attribute Value Ideal
Score: 6.5 out of 9
Category: Good Excellent
No. of Grammatical Errors: 2 2
No. of Spelling Errors: 4 2
No. of Sentences: 6 10
No. of Words: 243 200
No. of Characters: 1100 1000
No. of Different Words: 124 100
Fourth Root of Number of Words: 3.948 4.0
Average Word Length: 4.527 4.6
Word Length SD: 2.653 2.4
No. of Words greater than 5 chars: 65 60
No. of Words greater than 6 chars: 49 50
No. of Words greater than 7 chars: 32 40
No. of Words greater than 8 chars: 22 20
Use of Passive Voice (%): 0 0
Avg. Sentence Length: 40.5 21.0
Sentence Length SD: 12.646 7.5
Use of Discourse Markers (%): 0.667 0.12
Sentence-Text Coherence: 0.528 0.35
Sentence-Para Coherence: 0.849 0.50
Sentence-Sentence Coherence: 0.18 0.07
Number of Paragraphs: 4 4