The graph below presents the global bird flu casualties per year.
Summarise the information by selecting and report in the main features, and make comparisons where relevant.
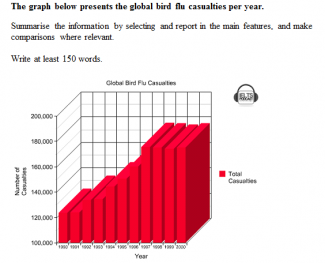
The graph illustrates the number of casualties from bird flu around the world between 1990 and 2000.
In 1990, the number of bird flu sufferers stood at about 123,000. By the following two years, this figure had risen to just above 130,000 causalities before falling to 125,000 in 1991. From 1992, the amount of causalities increased gradually to approximately 135,000 and then further rose almost by 10,000 to reach 145,000 in 1995.
Similarly, in 1996, the number of bird flu victims globally reached its highest, at about 150,000. The causalities further increased considerably to more than 17...
Subscribe as testbig VIP readers and get unlimited access to essays on the top list.

Comments
Hi, I really appreciate all
Hi,
I really appreciate all of your feedbacks.
Thank you so much testbig team.
Regards,
Prakash
Attribute Value Ideal
Score: 7.5 out of 9
Category: Very Good Excellent
No. of Grammatical Errors: 0 2
No. of Spelling Errors: 0 2
No. of Sentences: 8 10
No. of Words: 158 200
No. of Characters: 762 1000
No. of Different Words: 98 100
Fourth Root of Number of Words: 3.545 4.0
Average Word Length: 4.823 4.6
Word Length SD: 2.611 2.4
No. of Words greater than 5 chars: 53 60
No. of Words greater than 6 chars: 39 50
No. of Words greater than 7 chars: 20 40
No. of Words greater than 8 chars: 17 20
Use of Passive Voice (%): 0 0
Avg. Sentence Length: 19.75 21.0
Sentence Length SD: 4.63 7.5
Use of Discourse Markers (%): 0.5 0.12
Sentence-Text Coherence: 0.462 0.35
Sentence-Para Coherence: 0.696 0.50
Sentence-Sentence Coherence: 0.084 0.07
Number of Paragraphs: 4 4