The graph below shows the consumption of fish and some different kinds of meat in a European country between 1979 and 2004. Summarize the information by selecting and reporting the main features, and make comparisons where relevant.
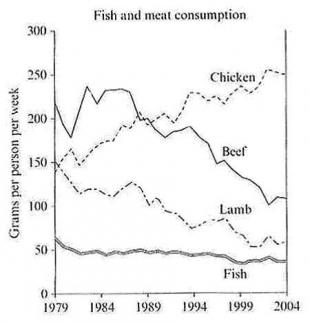
The given line graph illustrates the utilization of four sorts of meat such as chicken, beef, lamb and fish as grams per person per week in a European nation from 1979 to 2004.
To begin with, it is vivid that the consumption of chicken was constantly fluctuating throughout the aforesaid period and reached at approximately 250 grams from 150 grams in 2009. Additionally, the utilization of beef was around 220 grams in 1979 and then it was slightly varying till 1987. Afterwards, this has been gradually plunged and reached at 100 grams in the end of said period.
Furthermore, the consumption ...
Subscribe as testbig VIP readers and get unlimited access to essays on the top list.

Attribute Value Ideal
Score: 7.5 out of 9
Category: Very Good Excellent
No. of Grammatical Errors: 0 2
No. of Spelling Errors: 0 2
No. of Sentences: 8 10
No. of Words: 191 200
No. of Characters: 892 1000
No. of Different Words: 100 100
Fourth Root of Number of Words: 3.718 4.0
Average Word Length: 4.67 4.6
Word Length SD: 2.649 2.4
No. of Words greater than 5 chars: 52 60
No. of Words greater than 6 chars: 40 50
No. of Words greater than 7 chars: 28 40
No. of Words greater than 8 chars: 21 20
Use of Passive Voice (%): 0 0
Avg. Sentence Length: 23.875 21.0
Sentence Length SD: 5.533 7.5
Use of Discourse Markers (%): 0.625 0.12
Sentence-Text Coherence: 0.499 0.35
Sentence-Para Coherence: 0.737 0.50
Sentence-Sentence Coherence: 0.114 0.07
Number of Paragraphs: 4 4