The graph below shows the consumption of three spreads from 1981 to 2007.
Summarise the information by selecting and reporting the main features, and make comparisons where relevant.
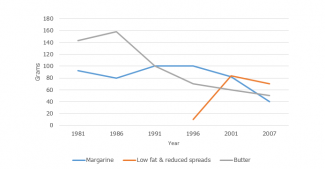
The line graph compares how much three kinds of spreads, namely margarine, low fat and reduced spreads, and butter, were consumed between 1981 and 2007.
Overall, while the consumption of margarine and butter went down, that of low fat & reduced spreads saw an upward trend.
Looking at the graph in detail, in 1981, just over 140 grams of butter were consumed, the highest figure in this year. Butter consumption then increased and peaked at 160 before going through a period of sharp decline and reaching 70 grams in 2007. The downward trend was also recorded in the consumption of margarine. ...
Subscribe as testbig VIP readers and get unlimited access to essays on the top list.

Attribute Value Ideal
Score: 8.0 out of 9
Category: Excellent Excellent
No. of Grammatical Errors: 0 2
No. of Spelling Errors: 0 2
No. of Sentences: 10 10
No. of Words: 199 200
No. of Characters: 924 1000
No. of Different Words: 109 100
Fourth Root of Number of Words: 3.756 4.0
Average Word Length: 4.643 4.6
Word Length SD: 2.349 2.4
No. of Words greater than 5 chars: 64 60
No. of Words greater than 6 chars: 43 50
No. of Words greater than 7 chars: 26 40
No. of Words greater than 8 chars: 15 20
Use of Passive Voice (%): 0 0
Avg. Sentence Length: 19.9 21.0
Sentence Length SD: 6.22 7.5
Use of Discourse Markers (%): 0.6 0.12
Sentence-Text Coherence: 0.407 0.35
Sentence-Para Coherence: 0.62 0.50
Sentence-Sentence Coherence: 0.066 0.07
Number of Paragraphs: 4 4