The graph below shows the proportion aged 65 and over between 1940 and 2040 in three different countries.(revised verison)
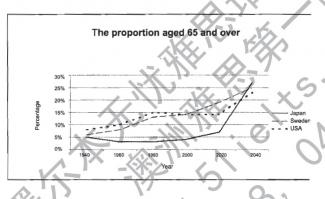
The line graph compares the percentage of aging population in three countries over the 100-year period
Overall, the figure of people aged 65 and over in three countries is projected to increase dramatically. As show by the graph, Japan is expected to present the highest figure over the entire period,at 27%. The USA and Sweden, who are likely to show similar figure. (23% and 25%).
In Japan, the population of aging population bottomed out in the first forty-year period, falling from 5% to only 2.5% by 1980, before it recovered during the 1990's. From this point onward, the figure saw a gradual rise, increasing to around 7% in 2010. After that, an upward trend is expected to be seen in the coming decades.
The figure in the USA and Sweden experienced a similar pattern, which doubled from approximately 7% and 6% to 15% and 13% in 1980. Subsequently, the trend in the USA is projected to level out until 2020, while the proportion of people aged 65 and above in Swden will fluctuate until the end of period.

Comments
hi, testbig team. I did some
hi, testbig team. I did some changes for this essay, please evalute ~
It is better this time. The
It is better this time. The band is around 7.0.
Don't go details from the graphs, but figure out the main features, and make comparison where relevant.
And you need to submit the revised essay as a new essay in order to get evaluated by Erater.
between 1940 and the projection figure in 2040
between the number in 1940 and the projection figure in 2040
flaws:
You lost some years from 2000-2040:
'Then, there was a further growth for Swedish who aged 65 and over,while the number in America stood at the same level.'
Do a search in testbig and you can find some good samples:
http://testbig.com/essays-list?keys=aged+65+and+over+between+1940+and+2…
Attribute Value Ideal
Score: 6.0 out of 9
Category: Satisfactory Excellent
No. of Grammatical Errors: 1 2
No. of Spelling Errors: 0 2
No. of Sentences: 9 10
No. of Words: 205 200
No. of Characters: 938 1000
No. of Different Words: 119 100
Fourth Root of Number of Words: 3.784 4.0
Average Word Length: 4.576 4.6
Word Length SD: 2.641 2.4
No. of Words greater than 5 chars: 58 60
No. of Words greater than 6 chars: 42 50
No. of Words greater than 7 chars: 32 40
No. of Words greater than 8 chars: 22 20
Use of Passive Voice (%): 0 0
Avg. Sentence Length: 22.778 21.0
Sentence Length SD: 2.699 7.5
Use of Discourse Markers (%): 0.667 0.12
Sentence-Text Coherence: 0.404 0.35
Sentence-Para Coherence: 0.667 0.50
Sentence-Sentence Coherence: 0.031 0.07
Number of Paragraphs: 4 4