The pie chart below shows the earning of the City of London for the years 1985 and 1995. These earnings are known as invisible earnings and they showed huge increases in the years studied. The graph shows comparisons between earnings for male and female executive in the various financial sectors for the same years.
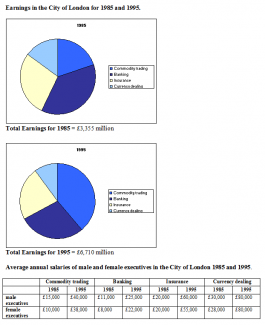
The pie charts show the overall earnings of the City of London over decade, from 1985 to 1995 while the table reveals the average annual salaries between men and women executives in the differences financial sectors.
According to the data, the highest of total earnings is recorded in 1995 while the average annual salaries for all financial sectors, male executives show the higher rate than female in 1985 onward.
Firstly, in 1985, the sector in banking was the highest sector which earn much money, followed by insurance in the second place then commodity trading and currency deal sector. Then, the total earning in that year was just £ 3,355 million. Compared in 1995, commodity trading earned much higher level than banking. Sector of banking, insurance and currency dealing were slightly decreased. In contrast, over ten years, the total earnings increased over double to £ 6,710 million.
Secondly, moving onto the table, the amount of money earned from male executive always got higher salaries than female for decade. Although, female executive had few salaries, their average salaries increased almost over triple from 1985 to 1995. Then, the average salaries rose up significantly in all of difference sectors in 1995 between male and female. Interestingly, the highest average annual salaries from currency dealing sector at £ 30,000 from male and £ 28,000 from female in 1985 and it increased highly to £ 80,000 both of them.
To sum up, the total earnings in City of London rose up dramatically for ten years and it affect to average annual salaries for various financial sectors.

the City of London over decade,
the City of London over a decade,
in the differences financial sectors.
in the different financial sectors.
while the average annual salaries for all financial sectors, male executives show the higher rate than female in 1985 onward.
while about the average annual salaries for all financial sectors, male executives show the higher rate than female in 1985 onward.
was the highest sector which earn much money,
was the highest sector which earns more money,
the total earnings increased over double to £ 6,710 million.
the total earnings over doubled to £ 6,710 million.
Sentence: Firstly, in 1985, the sector in banking was the highest sector which earn much money, followed by insurance in the second place then commodity trading and currency deal sector.
Description: The fragment which earn much is rare
Suggestion: Possible agreement error: Replace earn with verb, past tense
flaws:
No. of Grammatical Errors: 6 2
No. of Words: 256 200
Write the essay in 20 minutes.
Attribute Value Ideal
Score: 6.0 out of 9
Category: Satisfactory Excellent
No. of Grammatical Errors: 6 2
No. of Spelling Errors: 0 2
No. of Sentences: 12 10
No. of Words: 256 200
No. of Characters: 1298 1000
No. of Different Words: 116 100
Fourth Root of Number of Words: 4 4.0
Average Word Length: 5.07 4.6
Word Length SD: 2.344 2.4
No. of Words greater than 5 chars: 109 60
No. of Words greater than 6 chars: 72 50
No. of Words greater than 7 chars: 43 40
No. of Words greater than 8 chars: 21 20
Use of Passive Voice (%): 0 0
Avg. Sentence Length: 21.333 21.0
Sentence Length SD: 8.788 7.5
Use of Discourse Markers (%): 0.667 0.12
Sentence-Text Coherence: 0.416 0.35
Sentence-Para Coherence: 0.667 0.50
Sentence-Sentence Coherence: 0.129 0.07
Number of Paragraphs: 5 4