The pie chart show the percentage of person arrested in the five year period ending 1994 and the bar graph shows the most recent reasons for arrest.
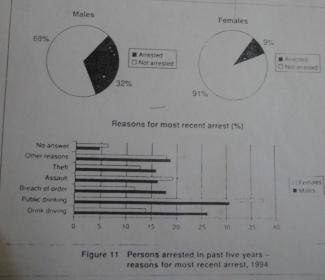
The pie chart illustrates the proportion of the people( male and female) was arrested in a five years period.The bar graph demonstrates the various reasons for most recent arrest. Overall, it can be seen that males were arrested more than females, and the public drinking was the most common cause for arrest for both gender.
To begin, percentage of the males arrested was much higher than the females. Males were arrested at 32% in a five year period whereas females were at 9%.
On the other hand, main cause of arrest for men was drink driving at approximately 27% and the figure for women was at 14%. The main reason for females was the public drinking at nearly 38%, compared to 31% for males. Beach of order and other reasons were also slightly higher for men, all standing at around 12-18% whereas, for females the assault was slightly greater than males at 18%.
In conclusion, Turning to the reasons for most recent arrest, there were some clear difference between men and women.

The pie chart illustrates the proportion of the people( male and female) was arrested in a five years period.
The pie chart illustrates the proportion of the people( male and female) who were arrested in a five year period.
flaws:
Need to improve your language. Read a sample:
http://www.testbig.com/ielts-writing-task-i-essays/diagrams-below-show-…
Attribute Value Ideal
Score: 6.0 out of 9
Category: Good Excellent
No. of Grammatical Errors: 0 2
No. of Spelling Errors: 0 2
No. of Sentences: 8 10
No. of Words: 173 200
No. of Characters: 787 1000
No. of Different Words: 92 100
Fourth Root of Number of Words: 3.627 4.0
Average Word Length: 4.549 4.6
Word Length SD: 2.249 2.4
No. of Words greater than 5 chars: 54 60
No. of Words greater than 6 chars: 34 50
No. of Words greater than 7 chars: 17 40
No. of Words greater than 8 chars: 7 20
Use of Passive Voice (%): 0 0
Avg. Sentence Length: 21.625 21.0
Sentence Length SD: 6.081 7.5
Use of Discourse Markers (%): 0.5 0.12
Sentence-Text Coherence: 0.455 0.35
Sentence-Para Coherence: 0.73 0.50
Sentence-Sentence Coherence: 0.096 0.07
Number of Paragraphs: 4 4