The pie charts below show units of electricity production by fuel source in Australia and France in 1980 and 2000. Summarize the information by selecting and reporting the main features, and make comparisons where relevant.
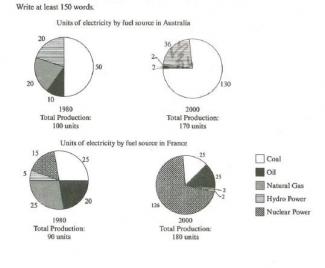
Given are the pie charts providing detailed information about the production of five different electricity sources by units in Australia and France during 1980 and 2000. It can be clearly seen that, coal production has the highest units in Australia during 1980 and 2000, 50 and 130 units respectively.
The next two domineering sources in Australia in 1980 are Hydro Power and Natural gas with 20 units, although Hydro Power increases by 16 units in 2000, natural gas levels drops ten times and reaches the bottom of 2 units in 2000. The only source is oil that has the lowest figures during both 1980 and 2000, 10 and 2 units respectively.
Referring to the pie chart it can also be observed that, coal and natural gas are the dominant sources in 1980 with 25 units. The next two categories, oil and nuclear power have lower units 20 and 15 units respectively and hydro power shows a sign of being the lowest source in 1980.
Nuclear power rates the highest units in 2000 (126 units) and all the remaining sources drops even lower with rare exception such as coal which remains unchanged with 25 units in 2000.

flaws:
Seems you missed France. and you need to make comparisons.
Attribute Value Ideal
Score: 6.5 out of 9
Category: Good Excellent
No. of Grammatical Errors: 0 2
No. of Spelling Errors: 0 2
No. of Sentences: 7 10
No. of Words: 196 200
No. of Characters: 898 1000
No. of Different Words: 97 100
Fourth Root of Number of Words: 3.742 4.0
Average Word Length: 4.582 4.6
Word Length SD: 2.369 2.4
No. of Words greater than 5 chars: 49 60
No. of Words greater than 6 chars: 38 50
No. of Words greater than 7 chars: 23 40
No. of Words greater than 8 chars: 19 20
Use of Passive Voice (%): 0 0
Avg. Sentence Length: 28 21.0
Sentence Length SD: 6.782 7.5
Use of Discourse Markers (%): 0.286 0.12
Sentence-Text Coherence: 0.573 0.35
Sentence-Para Coherence: 0.799 0.50
Sentence-Sentence Coherence: 0.197 0.07
Number of Paragraphs: 4 4