The table below shows the numbers of people in each age group working in certain sectors in the UK in 1998 and 2006.
Summarise the information by selecting and reporting the main features, and make comparisons where relevant
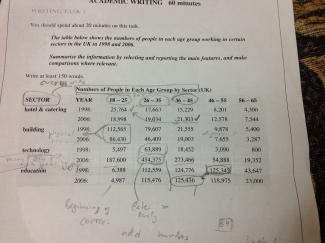
The table lists the counts of people in every age group functioning in some sectors in the UK between 1998 and 2006 .The data was compared by 4 main sectors ( hotel&catering, building, technology, education) and 5 various age discriminations.
First of all, in 1998, people who were employing in a hotel& catering field were in their 20s and were the highest ( approximately 26.000) while in 2006, the number of people decreased, became around 22.000. It altered and people who were keen on this job were in their late 30s and early 40s. At a glance, in both years, in build...
Subscribe as testbig VIP readers and get unlimited access to essays on the top list.

Attribute Value Ideal
Score: 7.0 out of 9
Category: Good Excellent
No. of Grammatical Errors: 0 2
No. of Spelling Errors: 0 2
No. of Sentences: 8 10
No. of Words: 240 200
No. of Characters: 1153 1000
No. of Different Words: 125 100
Fourth Root of Number of Words: 3.936 4.0
Average Word Length: 4.804 4.6
Word Length SD: 2.503 2.4
No. of Words greater than 5 chars: 80 60
No. of Words greater than 6 chars: 50 50
No. of Words greater than 7 chars: 36 40
No. of Words greater than 8 chars: 22 20
Use of Passive Voice (%): 0 0
Avg. Sentence Length: 30 21.0
Sentence Length SD: 14.526 7.5
Use of Discourse Markers (%): 0.5 0.12
Sentence-Text Coherence: 0.521 0.35
Sentence-Para Coherence: 0.677 0.50
Sentence-Sentence Coherence: 0.155 0.07
Number of Paragraphs: 3 4