The three pie charts below show the changes in annual spending by local authorities in Someland in 1980, 1990 and 2000.
Summarise the information by selecting and reporting the main features, and make comparisons where relevant.
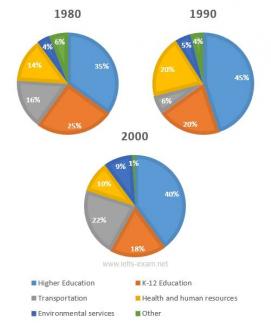
The three pie charts below represent the changes in expenditures of local authorities in 1980,1990 and 2000 in Someland.
Obviously, higher education accounted for the most part of the expenditures in all three years with 35, 45 and 40 % respectively. In 1980 , local authorities spent 25% of the annual spending to the K-12 Education, while these figures was decreasing moderately and in 2000 the proportion was one-fifth of all expenses. Transportation outlay decreased fairly in 1990; however it went up noticeably and constituted 18 % of annual costs in 2000. Local governs spent 14 % and 20% p...
Subscribe as testbig VIP readers and get unlimited access to essays on the top list.

while these figures was decreasing moderately
while these figures were decreasing moderately
Sentence: To note that, local authorities minimised money which was spent to other expenses.
Error: minimised Suggestion: minimized
Attribute Value Ideal
Score: 7.5 out of 9
Category: Very Good Excellent
No. of Grammatical Errors: 1 2
No. of Spelling Errors: 1 2
No. of Sentences: 9 10
No. of Words: 179 200
No. of Characters: 901 1000
No. of Different Words: 100 100
Fourth Root of Number of Words: 3.658 4.0
Average Word Length: 5.034 4.6
Word Length SD: 2.914 2.4
No. of Words greater than 5 chars: 56 60
No. of Words greater than 6 chars: 46 50
No. of Words greater than 7 chars: 41 40
No. of Words greater than 8 chars: 29 20
Use of Passive Voice (%): 0 0
Avg. Sentence Length: 19.889 21.0
Sentence Length SD: 8.875 7.5
Use of Discourse Markers (%): 0.444 0.12
Sentence-Text Coherence: 0.414 0.35
Sentence-Para Coherence: 0.667 0.50
Sentence-Sentence Coherence: 0.08 0.07
Number of Paragraphs: 3 4