The charts shows air pollution levels by different causes among four countries in 2021.
Summaries the information by selecting and reporting the main features, and make comparisons where relevant.
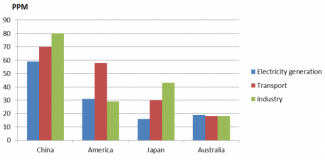
The provided chart informs about the levels of air pollution caused by electricity generation, transport and industry in China, America, Japan and Australia. The pollution level is measured in PPM.
Overall, Australia is the least polluted country among the four while China is the most polluted one.
The rate of air pollution in China ranged from about 60 PPM to 80 PPM where 60 PPM pollution was caused by electricity production, followed by 70 PPM caused by transport and 80 PPM by industrial incidents. Similar trends could be noticed in Japan but on a lower level as generation of electricity caused less than 20 PPM, vehicles caused 30 PPM and industry caused over 40 PPM polluted materials in air.
Although nearly 60 PPM air pollution resulted from transportation in America, making electric power and industrial works produced around 30 PPM pollution in the air. Finally, pollution level lower than 20 PPM was recorded in Australia in all cases.
