The graph below shows the consumption of fish and some different kinds of meat in a European country between 1979 and 2004.
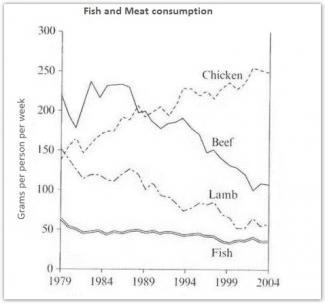
The bar graph elucidates the fish and meat consumption in grows per week in Europe from 1979 to 2004.
The beef consumption in Europe started at about 200 grams, which is fluctuated widely from below 200 grams to well above 200 grams in next 10 years. After that, there was a drastic decrease with the amount of beef consumption. This trend was similar for lamb consumption. Lesser European people preferred to purchase beef and lamb until 100 grams and about 60 grams consumed by 2004.
The chicken had eaten by European citizens at about 140 grams per week in the year of 1979; which increased more than the amount of lamb consumption. The amount of grams of chicken showed the steadily rose up to 250 grams per week in 2004. In 1989, the chicken's consumption was more than the beef's consumption (200 grams and 190 grams, respectively). From that point, European people preferred to eat chicken at its highest point of 250 grams per person per week in 2004. Meanwhile, the consumption of fish remained unchanged throughout the projected periods.
It is apparent that, the consumption on beef and lamb decreased while the consumption of chicken skyrocketed throughout the period – fish showed not much difference in the grams of consumption.

flaws:
It is time now to polish the sentences. They are not outstanding. read a sample:
http://www.testbig.com/ielts-essays/graph-below-shows-consumption-fish-…
----------------------
Attribute Value Ideal
Score: 6.5 out of 9
Category: Good Excellent
No. of Grammatical Errors: 0 2
No. of Spelling Errors: 0 2
No. of Sentences: 11 10
No. of Words: 210 200
No. of Characters: 1009 1000
No. of Different Words: 101 100
Fourth Root of Number of Words: 3.807 4.0
Average Word Length: 4.805 4.6
Word Length SD: 2.598 2.4
No. of Words greater than 5 chars: 59 60
No. of Words greater than 6 chars: 45 50
No. of Words greater than 7 chars: 36 40
No. of Words greater than 8 chars: 26 20
Use of Passive Voice (%): 0 0
Avg. Sentence Length: 19.091 21.0
Sentence Length SD: 6.788 7.5
Use of Discourse Markers (%): 0.182 0.12
Sentence-Text Coherence: 0.463 0.35
Sentence-Para Coherence: 0.641 0.50
Sentence-Sentence Coherence: 0.153 0.07
Number of Paragraphs: 4 4