the line graph shows visits to and from the uk from 1979 to 1999, and the bar graph shows the most popular countries visited by uk residents in 1999.
summarize the information by selecting and reporting the main features and make comparisons where relevant
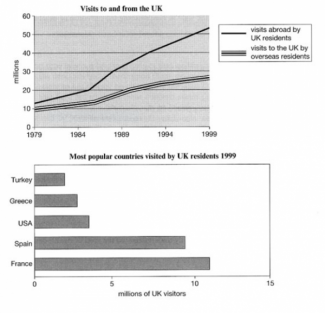
The line graph illustrates the number of visitors to and from UK over a 20 year period from 1979 to 1999 , while the bar chart provides data regarding popular destinations among the UK residents in 1999 . Units measured in millions if visitors. Overall it can be seen that number of travelers increased as years goes by and France was the most Favourite country to visit by UK residents .
In the line graph, to begin with , in 1979 almost similar number of visitors were there to and from UK at around 10 million . However the number of visitors to UK showed a slow and steady rise throughout given 20 year period, while the abroad visits by UK residents risen dramatically to reach about 53 millions , even though the growth of number of visitors was slow until 1985 . At the end of given period [ 1999 ] almost double the number of UK residents visited other countries than the number of people welcomed by UK .
In the second graph it is obvious that France was the most favourite country to visit by UK residents at approximately 12 millions of visitors , closely followed by Spain with around 10 million visitors in 1999 . Turkey was the least preferred holiday destination by UK people [2.5 million visitors ]. Interestingly the number of visitors to France in 1999 exceeds the combined number of visitors to Turkey, Greek and USA.

Units measured in millions if visitors.
Units are measured in millions of visitors.
Overall it can be seen that number of travelers increased as years goes by
Overall it can be seen that the number of travelers increased as years go by
almost double the number of UK residents visited other countries
almost double number of UK residents visited other countries
flaws:
No. of Grammatical Errors: 3 2
Don't put a space before punctuation marks.
Always put a space after punctuation marks. Essay e-rater is sensitive.
----------------------
Attribute Value Ideal
Score: 6.0 out of 9
Category: Good Excellent
No. of Grammatical Errors: 3 2
No. of Spelling Errors: 0 2
No. of Sentences: 9 10
No. of Words: 230 200
No. of Characters: 1074 1000
No. of Different Words: 111 100
Fourth Root of Number of Words: 3.894 4.0
Average Word Length: 4.67 4.6
Word Length SD: 2.532 2.4
No. of Words greater than 5 chars: 82 60
No. of Words greater than 6 chars: 51 50
No. of Words greater than 7 chars: 37 40
No. of Words greater than 8 chars: 19 20
Use of Passive Voice (%): 0 0
Avg. Sentence Length: 25.556 21.0
Sentence Length SD: 11.216 7.5
Use of Discourse Markers (%): 0.556 0.12
Sentence-Text Coherence: 0.519 0.35
Sentence-Para Coherence: 0.651 0.50
Sentence-Sentence Coherence: 0.148 0.07
Number of Paragraphs: 3 4