You should spend about 20 minutes on this task.
The graph below shows population figures for India and China since the year 2000 and predicted population growth up until 2050.
Summarise the information by selecting and reporting the main features, and make comparisons where relevant.
Write at least 150 words.
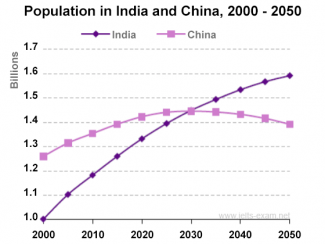
The provided graph demonstrates the change of population in China and India since 2000 and predicted population growth up until 2050.
In general, as prediction the population of India will rise steadily though the period while the China population is forecasted to witness a downward trend. In the future, the population of India will be higher than China.
As the given graph, in 2000, the population of India and China are 1 billion people and 1.25 billion people respectively. From 2000 to 2020, both India and China experienced a significant growth peaking at over 1.3 billion people.
After 2020, in comparison with India, which is predicted to rise dramatically in population and reaching the highest point of 1.6 billion people by 2050 while the population of china is expected to remain at about 1.45 billion people from 2025 to 2030 . From 2030 onwards, the number of China’s citizen will fall slightly to nearly 1.4 billion people in 2050.
