You should spend about 20 minutes on this task.
The table below shows the results of surveys in 2000, 2005 and 2010 about one university.
Summaries the information by selecting and reporting the main features, and make comparisons where relevant.
You should write at least 150 words.
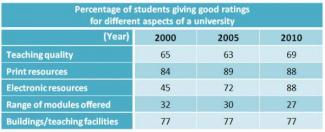
The given table expresses the student's ratings on different characteristics of an university, namely, the quality of teaching, the printing and electric resources, the offered courses and facilities, on surveys conducted in three different years with five years gap in each, one in 2000, again in 2005 and lastly in 2010.
According to the learners, the university provides the best printing services as it got more than 80% in all the surveys. On the other hand, the worst rating was given to the range of offered subjects since it was rated 32% and 30% simultenously in 2000 and 2005 and in 2010, the percentage dropped to 27%. Although the elctronic resources were graded 45% in 2000, it received 72% and 88% respectively in 2005 and 2010.
The quality of classroom did not changed much as the students' evaluation ranged around 65-69% in all interviwes. Only the offered infrastucture and teaching facilities remained similar thoroughout the years and had a constant grade, 77%.
