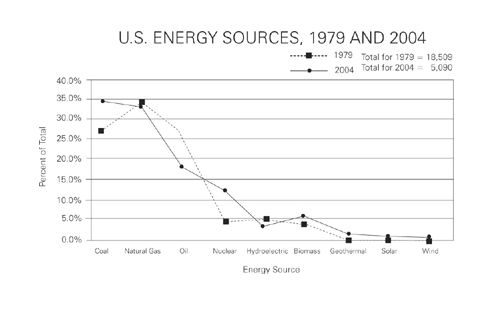
Which of the following can be inferred from the graphs? Indicate all possible values. A The number of power plants constructed in the U.S. between 1979 and 2004. B The percent of total energy used from oil, coal, and natural gas sources was greater in 2004 than the percent of total energy used from the same sources in 1979. C The amount of energy used from hydroelectric sources in 2004 was less than one fourth the amount of energy used from hydroelectric sources in 1979. Submit Log in or register to post comments