The bar chart gives information about the number of Japanese population (in millions) and the percentage of its elderly inhabitants over a 105-year period.
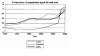
It is clear that apart from the year 2010, the population growth in Japan showed an upward trend from 1950 to 2005. In the same time, the proportion of the ageing people had risen until four times. In contrast, the prediction of Japanese population fell dramatically while the number of inhabitants over 65 years old is more likely increase over the next 40-year period.
A closer look at the data reveals that in 1950, the number of Japanese people was about 84 million and only just fewer than 5 percent of these inhabitants were older people (4.1 million). By 2005, both the rate of overall popu...
Subscribe as testbig VIP readers and get unlimited access to essays on the top list.

is more likely increase over the next 40-year period.
is more likely to increase over the next 40-year period.
Attribute Value Ideal
Score: 7.5 out of 9
Category: Very Good Excellent
No. of Grammatical Errors: 1 2
No. of Spelling Errors: 0 2
No. of Sentences: 8 10
No. of Words: 180 200
No. of Characters: 837 1000
No. of Different Words: 108 100
Fourth Root of Number of Words: 3.663 4.0
Average Word Length: 4.65 4.6
Word Length SD: 2.559 2.4
No. of Words greater than 5 chars: 53 60
No. of Words greater than 6 chars: 38 50
No. of Words greater than 7 chars: 25 40
No. of Words greater than 8 chars: 17 20
Use of Passive Voice (%): 0 0
Avg. Sentence Length: 22.5 21.0
Sentence Length SD: 7.246 7.5
Use of Discourse Markers (%): 0.625 0.12
Sentence-Text Coherence: 0.421 0.35
Sentence-Para Coherence: 0.621 0.50
Sentence-Sentence Coherence: 0.072 0.07
Number of Paragraphs: 3 4