The chart below gives information about global sales of games software, CDs and DVD or video. Write a report for a university lecturer describing the information.
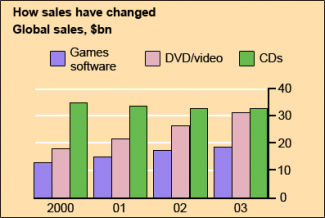
The given chart compares the amount of sales taking different products: games software, DVD/Video and CDs sold during a particular period of time over ranging 2000 to 2003.
Overall, looking backward 2003-2000, the amount of sold games software was a steady rise during the three years. Meanwhile, DVD/Video had more double amount of sales than in the 2000. However, the amount of sold CDs was a significant decrease from 2000 to 2003.
Turning to the chart, the sales of games software had a slight increase from 2000 to 2001 with 13-to-15 billion dollars and continued to 18 billion dollars in the 2002. Moreover, it was a peak in the 2003 with nearly 20 billion dollars.
More detailed look at the data indicates that between 2000 and 2001, the sales of DVD/video increased dramatically better the following years, with approximately 18-and-22 billion dollars. From 2002 onwards, the amount of sales suddenly began to grow sharply to 27 billion dollars, next continued to nearly 31 billion dollars in the 2003.
Moreover, the global products of CD achieved the highest amount in the 2000, while had a steady decline over 34 billion dollars in the 2001. Standing in contrast, this figure fell to a low of only 32 billion dollar in 2002, not leveling off until the end of year.

over ranging 2000 to 2003.
from 2000 to 2003.
the amount of sold games software was a steady rise during the three years.
the amount of games & software sales has a steady rise during the three years.
DVD/Video had more double amount of sales than in the 2000.
DVD/Video had more sales in double amount than that in the 2000.
the amount of sold CDs was a significant decrease from 2000 to 2003.
the amount of sold CDs has a significant decrease from 2000 to 2003.
it was a peak in the 2003
it has a peak in the 2003
Attribute Value Ideal
Score: 5.5 out of 9
Category: Satisfactory Excellent
No. of Grammatical Errors: 4 2
No. of Spelling Errors: 0 2
No. of Sentences: 10 10
No. of Words: 220 200
No. of Characters: 1029 1000
No. of Different Words: 109 100
Fourth Root of Number of Words: 3.851 4.0
Average Word Length: 4.677 4.6
Word Length SD: 2.351 2.4
No. of Words greater than 5 chars: 76 60
No. of Words greater than 6 chars: 56 50
No. of Words greater than 7 chars: 31 40
No. of Words greater than 8 chars: 13 20
Use of Passive Voice (%): 0 0
Avg. Sentence Length: 22 21.0
Sentence Length SD: 6.481 7.5
Use of Discourse Markers (%): 0.5 0.12
Sentence-Text Coherence: 0.476 0.35
Sentence-Para Coherence: 0.75 0.50
Sentence-Sentence Coherence: 0.148 0.07
Number of Paragraphs: 5 4