The chart below shows the amount of money per week spent on fast foods in Britain. The graph shows the trends in consumption of fast foods. Write a report for a university lecturer describing the information shown below.
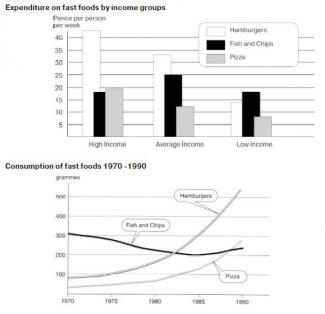
Given the bar chart depicts percentage how Britons spent the amount of money for buying three types of fast food: Hamburgers, Fish & Chips and Pizza. Moreover, the line graph illustrates the fast-food consumption ranging from 1970 to 1990.
In general, the figures reveal that hamburger was the highest income in weekly which was the popular meal consumption, while fish and chips had a fluctuation percentage during a period of 20 years.
First of all, hamburger had the highest percentage more than 40% in high income category, while fish & chips and pizza came to second and third with nearly 20%. Meanwhile, in average income category hamburger still led as the highest percentage, but there were differences that the fish & chips achieved higher percentage (25%) than pizza (12%). Standing in contras, fish & chips got the highest percentage in nearly 20 pence, while the percentage of hamburger declined by 13% and pizza fell to 6%.
A more detailed look at the line graph shows that hamburger and pizza started from under 100 pieces, while fish & chips had over 300 grammes in 1970. The first ten-year period, between 1970 and 1980, hamburger and pizza increased steadily, but fish & chips decreased less than 250 grammes. In 1985 onward, hamburger and pizza still rose sharply and sat a peak at over 500 grammes for hamburger, nearly 300 grammes for pizza. However, in 1990, fish & chips had again reached the same figure as in the middle 1975s with 250 grammes.
If we analyze the data we can see several trends clearly. Firstly, the percentage of hamburger in high income category was tripled than that in low income category. While the percentage hamburger and pizza were a sharp fall, fish & chips had a fluctuation percentage in three income categories. Having said and done, from 1970 to 1985, the grammes of hamburger and pizza increased significantly as many as percentage in high income.
To conclude them, I deliberate that hamburger was the popular type of fast food which was consumed and held the highest income in weekly spending by Briton.

Given the bar chart
the Given bar chart
hamburger was the highest income
Description: can you re-write this sentence?
Sentence: While the percentage hamburger and pizza were a sharp fall, fish & chips had a fluctuation percentage in three income categories.
Description: The fragment a sharp fall is not usually preceded by were
Suggestion: Possible agreement error: Replace were with was
Sentence: To conclude them, I deliberate that hamburger was the popular type of fast food which was consumed and held the highest income in weekly spending by Briton.
Description: A pronoun, personal, nominative, not 3rd person singular is not usually followed by an adjective
Suggestion: Refer to I and deliberate
flaws:
No. of Grammatical Errors: 4 2
No. of Words: 341 200
Number of Paragraphs: 6 4
Write the essay in 20 minutes.
Attribute Value Ideal
Score: 6.5 out of 9
Category: Good Excellent
No. of Grammatical Errors: 4 2
No. of Spelling Errors: 0 2
No. of Sentences: 15 10
No. of Words: 341 200
No. of Characters: 1652 1000
No. of Different Words: 160 100
Fourth Root of Number of Words: 4.297 4.0
Average Word Length: 4.845 4.6
Word Length SD: 2.444 2.4
No. of Words greater than 5 chars: 110 60
No. of Words greater than 6 chars: 82 50
No. of Words greater than 7 chars: 52 40
No. of Words greater than 8 chars: 38 20
Use of Passive Voice (%): 0 0
Avg. Sentence Length: 22.733 21.0
Sentence Length SD: 5.744 7.5
Use of Discourse Markers (%): 0.8 0.12
Sentence-Text Coherence: 0.433 0.35
Sentence-Para Coherence: 0.701 0.50
Sentence-Sentence Coherence: 0.196 0.07
Number of Paragraphs: 6 4