The chart below shows the different levels of post-school qualifications in Australia and the proportion of men and women who held them in 1999. Summarise the information by selecting and reporting the main features, and make comparisons where relevant.
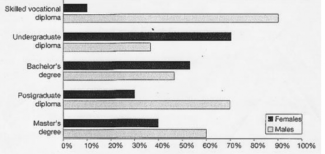
The graph given is a multiple bar chart showing different qualifications drawn against percentage of students who took these in Australia in the year 1999.
Overall, according to the chart, female majority was more inclined towards the undergraduate and bachelors program. The rest of the degree or diploma courses were enrolled mostly by men. There is no definite trend given in the graph regarding the sex differences in these training programs.
Firstly, talking about females, almost 70% were admitted into the undergraduate diploma. This is the highest number enrollments among females. 60% of the women were interested in bachelor’s degree. Whereas, only 40% of them took admission in Master’s degree and 30% in postgraduate diploma. The least number of women did skilled vocational diploma.
As compared to them, the highest percentage of males, approximately 90%, qualified in skilled vocational diploma. In the class of undergraduate diploma, 40% were males and the opposite was true for Master’s degree. Around half of the bachelor’s degree students were males. This figure increased to 70% in postgraduate diploma program.

Attribute Value Ideal
Score: 6.5 out of 9
Category: Good Excellent
No. of Grammatical Errors: 0 2
No. of Spelling Errors: 0 2
No. of Sentences: 13 10
No. of Words: 175 200
No. of Characters: 927 1000
No. of Different Words: 100 100
Fourth Root of Number of Words: 3.637 4.0
Average Word Length: 5.297 4.6
Word Length SD: 2.911 2.4
No. of Words greater than 5 chars: 73 60
No. of Words greater than 6 chars: 61 50
No. of Words greater than 7 chars: 38 40
No. of Words greater than 8 chars: 24 20
Use of Passive Voice (%): 0 0
Avg. Sentence Length: 13.462 21.0
Sentence Length SD: 4.684 7.5
Use of Discourse Markers (%): 0.231 0.12
Sentence-Text Coherence: 0.364 0.35
Sentence-Para Coherence: 0.566 0.50
Sentence-Sentence Coherence: 0.1 0.07
Number of Paragraphs: 4 4