The chart below shows how people travelled to work in 1996 and 2001 .
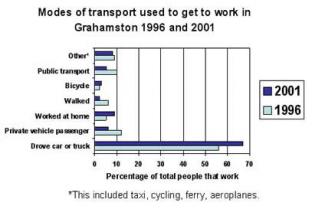
This bar chart shows about which transport people mostly used to get to their work in Grahamston between 1996 and 2001.
first of all, the most useful transportation of the workers is drove car or truck from the others. For example, it illustrates 68 percent of drove car in 2001. which is the highest one that people can use transport to get their work. and following this, the truck 58 percent in 1996, respectively. in 1996, Private vehicle passengers used to get to work in Grahamston over 10 percent of people. however, by 2001, it had a bit less percentage.
In this chart you can see that other transportation, is included taxi, cycling and ferry is almost equal percentage for both year.
nevertheless, the lowest percentage of the transportation has bicycle which is 6 percentage of people used in 2001 and only 4 percentage of people that work to used in 1996.

other transportation, is included taxi, cycling and ferry is almost equal percentage for both year.
Description: can you re-write this sentence?
which is 6 percentage of people used in 2001 and only 4 percentage of people that work to used in 1996.
Description: can you re-write this sentence?
-----------------------------------------------------------------------------------------
Always capitalize the first letter of a sentence.
Attribute Value Ideal
Score: 5.0 out of 9
Category: Satisfactory Excellent
No. of Grammatical Errors: 2 2
No. of Spelling Errors: 0 2
No. of Sentences: 5 10
No. of Words: 152 200
No. of Characters: 697 1000
No. of Different Words: 82 100
Fourth Root of Number of Words: 3.511 4.0
Average Word Length: 4.586 4.6
Word Length SD: 2.759 2.4
No. of Words greater than 5 chars: 40 60
No. of Words greater than 6 chars: 30 50
No. of Words greater than 7 chars: 18 40
No. of Words greater than 8 chars: 17 20
Use of Passive Voice (%): 0 0
Avg. Sentence Length: 30.4 21.0
Sentence Length SD: 15.806 7.5
Use of Discourse Markers (%): 0.6 0.12
Sentence-Text Coherence: 0.533 0.35
Sentence-Para Coherence: 0.876 0.50
Sentence-Sentence Coherence: 0.1 0.07
Number of Paragraphs: 4 4