The chart below shows information about changes in average house prices in five different cities between 1990 and 2002 compared with the average house prices in 1989.
Summarise the information by selecting and reporting the main features, and make comparisons where relevant.
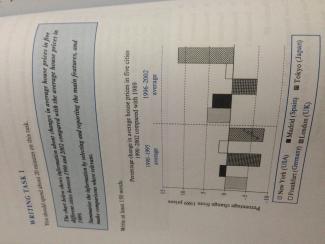
The bar chart illustrates the data about differences and diversities in average a family's home cost in variety of countries in 1990 and after 12 years compared with average home cost in 1989.
In the first half decade, the proportion of the UK is the same as Japan, approximately -7.5%, and also is the smallest. However, New York is -5% and smaller than Madrid, whereas the Germany is in the highest and the greatest. Therefore, London and Japan were affluent and well-off in 1990. Nevertheless, the estimation of London rockets considerably, and unexpectedly. At a glance, between 1996-2002, it is noticeable that Tokyo remains constant, and a big discrepancy is not seen. Despite, New York doubles significantly, while at the same time, Madrid increases steadily, and the Frankfurt decreases gradually.
In conclusion, there is a substantial growth in London, Madrid, New York, but the others drop spontaneously which means UK spends a lot than the others. In addition, it has to be noted down that the little price was spent by Germany

flaws:
This sentence is confusing:
'The bar chart illustrates the data about differences and diversities in average a family's home cost in variety of countries in 1990 and after 12 years compared with average home cost in 1989.'
When you are writing a sentence, make sure what and where is the subject, verb and object.
Read good samples:
http://testbig.com/ielts-essays/chart-below-shows-information-about-cha…
http://testbig.com/ielts-essays/cheart-below-shows-information-about-ch…
Attribute Value Ideal
Score: 5.5 out of 9
Category: Satisfactory Excellent
No. of Grammatical Errors: 0 2
No. of Spelling Errors: 0 2
No. of Sentences: 9 10
No. of Words: 172 200
No. of Characters: 835 1000
No. of Different Words: 109 100
Fourth Root of Number of Words: 3.621 4.0
Average Word Length: 4.855 4.6
Word Length SD: 2.879 2.4
No. of Words greater than 5 chars: 58 60
No. of Words greater than 6 chars: 45 50
No. of Words greater than 7 chars: 31 40
No. of Words greater than 8 chars: 22 20
Use of Passive Voice (%): 0 0
Avg. Sentence Length: 19.111 21.0
Sentence Length SD: 7.031 7.5
Use of Discourse Markers (%): 0.778 0.12
Sentence-Text Coherence: 0.357 0.35
Sentence-Para Coherence: 0.552 0.50
Sentence-Sentence Coherence: 0.028 0.07
Number of Paragraphs: 3 4