The chart below shows the total number of minutes (in billions) of telephone calls in the UK, divided into three categories, from 1995-2002. Summarise the information by selecting and reporting the main features, and make comparisons where relevant.
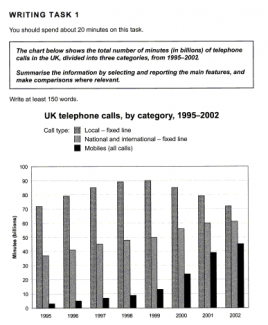
The graph shows a changing number of times in minutes of calling in UK from 1996 to 2002. It divided into three different categories, from local-fixed line, national and international-fixed line, and the last mobile-line. In overall, it can be seen that the number of minutes in three categories were steadily upwards, except local-fixed line which dropped moderately after getting peak at 1994.
The upcoming trend of national and international-fixed line started from around 37 billion in 1995, and it climbed until 60 billion in 2001, then it had a modest increase again into 62 billion at the end of 2002. Similar to this figure, category of mobile-line was continuing increase from just around 3 billion in 1990 to 45 billion in 2002.
It is notable that local-fixed line was the most popular category for calling than others. Even, it showed a fluctuation trend, but it never reached below 70 billion minutes. After starting around 72 billion in 1995, it continued to increase until getting a peak at 90 billion in 1995, and started to go down until comeback to approximately 72 billion at 2002. It was mostly twice from national and international-fixed line, and seven times higher than mobile call between 1995 and 1999. On the other hand, it appeared different trend starting from 1999 to 2002 when two difference categories came closer until it make around 10 and 30 billion difference, respectively, for local-fixed line and mobile-line.

the number of minutes in three categories were steadily upwards
the number of minutes in three categories was steadily upward
it appeared different trend
it appeared in a different trend
which dropped moderately after getting peak at 1994.
Description: no year for 1994
Attribute Value Ideal
Score: 6.0 out of 9
Category: Good Excellent
No. of Grammatical Errors: 3 2
No. of Spelling Errors: 0 2
No. of Sentences: 10 10
No. of Words: 239 200
No. of Characters: 1182 1000
No. of Different Words: 122 100
Fourth Root of Number of Words: 3.932 4.0
Average Word Length: 4.946 4.6
Word Length SD: 3.029 2.4
No. of Words greater than 5 chars: 82 60
No. of Words greater than 6 chars: 67 50
No. of Words greater than 7 chars: 38 40
No. of Words greater than 8 chars: 23 20
Use of Passive Voice (%): 0 0
Avg. Sentence Length: 23.9 21.0
Sentence Length SD: 8.24 7.5
Use of Discourse Markers (%): 0.3 0.12
Sentence-Text Coherence: 0.459 0.35
Sentence-Para Coherence: 0.609 0.50
Sentence-Sentence Coherence: 0.131 0.07
Number of Paragraphs: 3 4