The charts below give information about USA marriage and divorce rates between 1970 and 2000, and the marital status adult American in two of the years. . Summarize the information by selecting and reporting the main features, and make comparisons where relevant
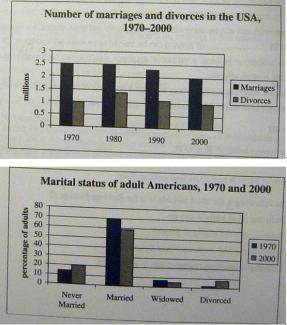
The given bar graphs depict about marriage as well as divorce rates from 1970 to 2000 in the Unites States of America and the marital status of adults American in percentage in two particular years 1970 and 2000.
At a first glance, it can be generally observed that there was exact same number of individuals who involved in marriages in the year of 1970 and 1980. However, the divorce rates was approximately 0.5 million higher in 1980 as compared to 1970. The marriages as well as divorces rate has been slightly plunged in 2000 in comparison to previous years. Although, the marriages rate was almost doubled in contrast to divorces rate in 2000.
Furthermore, it is demonstrated that the percentage of adults who married has been slumped from 70 to 59 in 2000. Though, it was hiked by approximately 5% in the category of never married. What is more, the percentage of widowed was almost same in two aforesaid years. Even though, the percentage of divorced adults has been dramatically enhanced between said years.
Laconically, it is crystallized that both marriage and divorce rates has been slightly declined in 2000. However, the number of divorced adults has been steadily climbed up in the year of 2000 as compared to former year in the Unites States of America.

both marriage and divorce rates has been slightly declined in 2000
both marriage and divorce rates have been slightly declined in 2000
Attribute Value Ideal
Score: 7.0 out of 9
Category: Good Excellent
No. of Grammatical Errors: 1 2
No. of Spelling Errors: 0 2
No. of Sentences: 11 10
No. of Words: 217 200
No. of Characters: 1032 1000
No. of Different Words: 101 100
Fourth Root of Number of Words: 3.838 4.0
Average Word Length: 4.756 4.6
Word Length SD: 2.669 2.4
No. of Words greater than 5 chars: 76 60
No. of Words greater than 6 chars: 56 50
No. of Words greater than 7 chars: 39 40
No. of Words greater than 8 chars: 19 20
Use of Passive Voice (%): 0 0
Avg. Sentence Length: 19.727 21.0
Sentence Length SD: 7.617 7.5
Use of Discourse Markers (%): 0.727 0.12
Sentence-Text Coherence: 0.414 0.35
Sentence-Para Coherence: 0.638 0.50
Sentence-Sentence Coherence: 0.107 0.07
Number of Paragraphs: 4 4