The diagram below contain information regarding the percentage of people occupied in various type of position in 1998 and 2001.
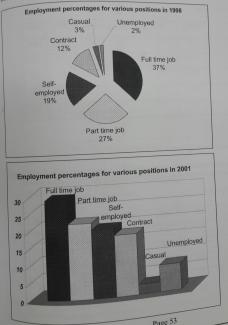
The two figures compare the number of people who have been hired in different areas in the years 1998 and 2001. It can be clearly seen that while some positions maintained their percentages of employment, other positions had more or less workforce.
According to the pie chart and the bar graph, both areas of casual and self-employed leveled out at approximately the same percentage in the year 1998 and 2001, 3% and 19% respectively. In contrast, more people have worked with contract in 2001 than 1998 which caused an increase in the percentage of this domain by 4 percent. As well, the numbers of unemployed had a similar sharp growth by reaching 6% in 2001.
Furthermore, other sites experienced decreasing in their percentage of employment. Part-time jobs had a slight drop by around 7% in 2001. But, full-time jobs recorded a significant reduction of hiring people in the same year by about 11 percent.
To summarize, the pie charts and the bar charts describe the number of people who took places in diverse positions in 1998 and 2001. It is obvious that some domains were faced with growths or falls in the amount of employing whereas only two of the sites stayed constant at the same percentages.

flaws:
This is not conclusion:
'To summarize, the pie charts and the bar charts describe the number of people who took places in diverse positions in 1998 and 2001.'
and the conclusion paragraph is duplicated to the introduction. It could be removed.
Attribute Value Ideal
Score: 7.0 out of 9
Category: Good Excellent
No. of Grammatical Errors: 0 2
No. of Spelling Errors: 0 2
No. of Sentences: 10 10
No. of Words: 207 200
No. of Characters: 975 1000
No. of Different Words: 120 100
Fourth Root of Number of Words: 3.793 4.0
Average Word Length: 4.71 4.6
Word Length SD: 2.707 2.4
No. of Words greater than 5 chars: 66 60
No. of Words greater than 6 chars: 47 50
No. of Words greater than 7 chars: 34 40
No. of Words greater than 8 chars: 27 20
Use of Passive Voice (%): 0 0
Avg. Sentence Length: 20.7 21.0
Sentence Length SD: 6.812 7.5
Use of Discourse Markers (%): 0.6 0.12
Sentence-Text Coherence: 0.397 0.35
Sentence-Para Coherence: 0.639 0.50
Sentence-Sentence Coherence: 0.037 0.07
Number of Paragraphs: 4 4