Education in Australia between 1997 and 2005.
The tables show the education for students in Australia among 1997 and 2005.
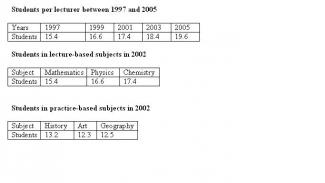
Generally, the data of students increased steadily every year, from 15.4 in 1997 until 19.6 in 2005. It has that the average number of students participated in a lecture of lecture-based and practice-based ones at the year of 2002 and the proportition between students and lecturers for 9 year period from 1997 to 2005. Overall, the learner that took part in lecture-based subjects, was more than the same in practice ones.
In 2002, in lecture-based subjects, the total of Chemistry’s learners was highest with 17.4 that was the average number of students per that lecture. Whereas, the lowest rate was from Mathematics with 15.4 and 16.6 was of Physics. The number of students joined with exercise lessons such as: History, Art, Geography, was much less than those of lecture based subjects with 13.2, 12.3, 12.5.
To summary, the rate between students and lecturers was getting bigger. Moreover, the number of students that took part in Chemistry was highest.

increased steadily every year,
increased steadily in every year,
It has that the average number of students participated in a lecture of lecture-based and practice-based ones at the year of 2002 and the proportition between students and lecturers for 9 year period from 1997 to 2005.
Description: can you re-write this sentence?
Whereas, the lowest rate was from Mathematics with 15.4 and 16.6 was of Physics.
Whereas, the lowest rate was from Mathematics with 15.4, and 16.6 for Physics.
Sentence: It has that the average number of students participated in a lecture of lecture-based and practice-based ones at the year of 2002 and the proportition between students and lecturers for 9 year period from 1997 to 2005.
Error: proportition Suggestion: proportion
flaws:
Didn't describe the tables clearly.
Attribute Value Ideal
Score: 4.5 out of 9
Category: Poor Excellent
No. of Grammatical Errors: 3 2
No. of Spelling Errors: 1 2
No. of Sentences: 9 10
No. of Words: 171 200
No. of Characters: 843 1000
No. of Different Words: 88 100
Fourth Root of Number of Words: 3.616 4.0
Average Word Length: 4.93 4.6
Word Length SD: 2.67 2.4
No. of Words greater than 5 chars: 58 60
No. of Words greater than 6 chars: 49 50
No. of Words greater than 7 chars: 32 40
No. of Words greater than 8 chars: 16 20
Use of Passive Voice (%): 0 0
Avg. Sentence Length: 19 21.0
Sentence Length SD: 8.028 7.5
Use of Discourse Markers (%): 0.333 0.12
Sentence-Text Coherence: 0.443 0.35
Sentence-Para Coherence: 0.69 0.50
Sentence-Sentence Coherence: 0.104 0.07
Number of Paragraphs: 4 4