The graph bellow shows the consumption of fish and some different kinds of meat in a European country between 1979 and 2004
Summarize the information by selecting and reporting the main features, and make comparisons where relevant
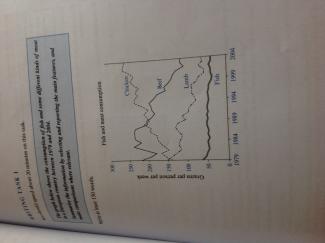
The given graph illustrates the various of consumption such as fish and meat is depleted year by year in a European country within 25 years.
Regarding graph,we can easily see, in 1979, the weekly proportion of fish is approximately 50 grams and the smallest, whereas the chicken and lamp are more than 3 times. Despite it, the greatest one is beef which is needed by per person approximately 220 grams. It is considerable that in a decade, the fish declares steadily,while at the same time, the chicken increases and reaches to the beef which goes up unexpectedly. It is clear that the demand of fish is not changed dramatically by people. At a glance, lamp decreases in a significant way, it loses one-third of grams and becomes 100 grams. It is sufficient that in 2004 there is also seen a slight diversity on fish,while the lamp drops unbelievably. More specifically, the chicken rockets and reaches to the first top the list which people require it too much(250 grams a person within a week). If analyze the graph we can observe that beef plunged unexpectedly,however it was the greatest in the first year.
In conclusion, it is sufficient that there is a minuscule going down on fish,whereas the beef and lamp plummet simultaneously. It suggests people's taste changes day by day, and consequently the chicken is most required.

The given graph illustrates the various of consumption such as fish and meat is depleted year by year
The given graph illustrates the various of consumptions such as fish and meat are depleted year by year
Sentence: If analyze the graph we can observe that beef plunged unexpectedly,however it was the greatest in the first year.
Description: A conjunction, subordinating is not usually followed by a verb, base: uninflected present, imperative or infinitive
Suggestion: Refer to If and analyze
------------------------------------------------------------
Your essays in task I are better than that in task II.
------------------------------------------------------------
Attribute Value Ideal
Score: 6.5 out of 9
Category: Good Excellent
No. of Grammatical Errors: 1 2
No. of Spelling Errors: 1 2
No. of Sentences: 11 10
No. of Words: 232 200
No. of Characters: 1076 1000
No. of Different Words: 126 100
Fourth Root of Number of Words: 3.903 4.0
Average Word Length: 4.638 4.6
Word Length SD: 2.794 2.4
No. of Words greater than 5 chars: 68 60
No. of Words greater than 6 chars: 55 50
No. of Words greater than 7 chars: 33 40
No. of Words greater than 8 chars: 23 20
Use of Passive Voice (%): 0 0
Avg. Sentence Length: 21.091 21.0
Sentence Length SD: 5.071 7.5
Use of Discourse Markers (%): 0.727 0.12
Sentence-Text Coherence: 0.381 0.35
Sentence-Para Coherence: 0.528 0.50
Sentence-Sentence Coherence: 0.084 0.07
Number of Paragraphs: 3 4