the graph below shows cinema attendance by age in Great Britain
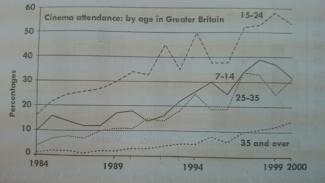
The graph gives information about the percentage of attending cinema by different ages which are categorized in four categories over a period of 1984 to 2000 in Greater Britain.
In 1984 the lowest percentage of cinema attendance is for the age 35 and over while the group “15-24” is the people who go to the movies the most. Since 1984 to 1991 in all groups the slight increase has been illustrated with some marked fluctuation for the group “7-14”. In the next four years, there are two dramatic fluctuations for the group “15-24” and there is a huge increase for the groups of “7-14” and “25-35” and simultaneously the steady rise for the group “35 and over”. Afterwards, in 1996 there are huge falls back for the two groups “7-14” and “35 and over” while there is no significant change has happened for the groups “15-24” and “25-35”. Over the year 1997, there is an insignificant fall for the group “25-3” and in a same time the other trends has had a gentle recover. And during the year 1998 and 1999 two different behaviors has indicated among groups “15-24”, “35 and over” and groups “7-14”, “25-35”.
Overall, after a lot of rise and fall over this period, all percentages have a total growth. The same as 1984 the group “15-24” has a highest percentages while the lowest cinema attendance is belonged to the group “35 and over” by considering the more gaps among them.

while there is no significant change has happened for the groups
while there is no significant change happened for the groups
while there is no significant change which has happened for the groups
the other trends has had a gentle recover.
the other trends have had a gentle recover.
two different behaviors has indicated among groups
two different behaviors have indicated among groups
has a highest percentages
has the highest percentages
flaws:
No. of Grammatical Errors: 4 2
No. of Words: 244 200
Write the essay in 20 minutes.
Attribute Value Ideal
Score: 6.5 out of 9
Category: Good Excellent
No. of Grammatical Errors: 4 2
No. of Spelling Errors: 0 2
No. of Sentences: 9 10
No. of Words: 244 200
No. of Characters: 1083 1000
No. of Different Words: 112 100
Fourth Root of Number of Words: 3.952 4.0
Average Word Length: 4.439 4.6
Word Length SD: 2.433 2.4
No. of Words greater than 5 chars: 55 60
No. of Words greater than 6 chars: 32 50
No. of Words greater than 7 chars: 27 40
No. of Words greater than 8 chars: 22 20
Use of Passive Voice (%): 0 0
Avg. Sentence Length: 27.111 21.0
Sentence Length SD: 5.99 7.5
Use of Discourse Markers (%): 0.333 0.12
Sentence-Text Coherence: 0.492 0.35
Sentence-Para Coherence: 0.657 0.50
Sentence-Sentence Coherence: 0.194 0.07
Number of Paragraphs: 3 4