The graph below shows the percentage of urban/suburban and rural households in a European country that had Internet access between 2008 and 2013.
Summarize the information by selecting and reporting the main features, and make comparisons where relevant.
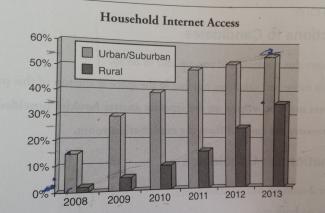
The bar chart illustrates the Internet access rate of urban/suburban and rural households from 2008 to 2013 in percentages. Overall, it can be clearly seen that household Internet access in both urban and rural areas dramatically increased, but the former remained at a higher rate than the latter over the given period.
At the beginning of the period, in 2008, the number of urban/suburban houses that were equipped with Internet access accounted for approximately 15 percent, whereas this data for rural homes was noticeably lower at less than 5 percent. The percentage of urban/suburban homes with Internet access rose sharply to 50 percent over the first four years; and then kept increasing gradually until it reached a peak in 2013 of about 55%.
On the other hand, the rate of Internet access in rural areas, meanwhile, continued growing at a steady rate, finishing the period at 35%.
Despite at the beginning of the shown period the Internet availability in urban/suburban vicinities was significantly higher than that of rural areas, this difference fell to a minimum by 2013. Hence, rural homes with Internet access accounted for almost two third of urban households over the last year.

Despite at the beginning of the shown period the Internet availability in urban/suburban vicinities was significantly higher than that of rural areas
Despite the fact that at the beginning of the shown period the Internet availability in urban/suburban vicinities was significantly higher than that of rural areas
Attribute Value Ideal
Score: 7.0 out of 9
Category: Good Excellent
No. of Grammatical Errors: 1 2
No. of Spelling Errors: 0 2
No. of Sentences: 7 10
No. of Words: 199 200
No. of Characters: 976 1000
No. of Different Words: 104 100
Fourth Root of Number of Words: 3.756 4.0
Average Word Length: 4.905 4.6
Word Length SD: 2.596 2.4
No. of Words greater than 5 chars: 65 60
No. of Words greater than 6 chars: 47 50
No. of Words greater than 7 chars: 36 40
No. of Words greater than 8 chars: 23 20
Use of Passive Voice (%): 0 0
Avg. Sentence Length: 28.429 21.0
Sentence Length SD: 7.267 7.5
Use of Discourse Markers (%): 0.714 0.12
Sentence-Text Coherence: 0.537 0.35
Sentence-Para Coherence: 0.791 0.50
Sentence-Sentence Coherence: 0.128 0.07
Number of Paragraphs: 4 4