The graph below shows the proportion of the population aged 65 and over between 1940 and 2040 in three different countries.
Summarize the information by selecting and reporting the main feature and make comparisons where relevant.
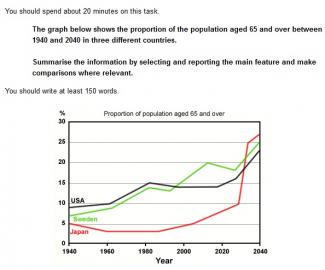
The line graph illustrates the three different places showing the part of their population aged 65 over in between 1940 and 2040.
Firstly, USA stayed on top having 9% aged 65 as part of their population. After that Sweden followed by 7% and lastly Japan got 5% in 1940. In between 1960 and 1985, Japan remained stable in its 3% position, whilst Sweden and USA inclined simultaneously in the middle of 1960 and 1980. However, in 1980 to 2000 Japan partly recovered back to 5%, while Sweden and USA dropped dramatically and consistently, but then, recovered to climbed steadily once more from 2030 until 2040.
Let us have a closer look, at first Japan remained the lowest percentage in the proportion of population aged 65 and over, then followed by Sweden and USA. Indeed, by the year 2040, Japan achieved 28%, followed by Sweden 25%, lastly USA with 15%.
In conclusion, Japan rose up from 5% to 28% from 1940 to 2040. On the other hand, Sweden with 7% to 25% and USA with 9% to 23% ranging from 1940 to 2040. The line graph shows that the three countries have a variable trends in its statistics.

The line graph illustrates the three different places
The line graph illustrates three different places
In between 1960 and 1985
between 1960 and 1985
flaws:
The content is not developed smoothly. Read some good samples:
http://www.testbig.com/ielts-writing-task-i-essays/graph-below-shows-pe…
http://www.testbig.com/ielts-writing-task-i-essays/graph-attached
http://www.testbig.com/ielts-writing-task-i-essays/graph-shows-proporti…
Attribute Value Ideal
Score: 5.5 out of 9
Category: Satisfactory Excellent
No. of Grammatical Errors: 2 2
No. of Spelling Errors: 0 2
No. of Sentences: 10 10
No. of Words: 197 200
No. of Characters: 861 1000
No. of Different Words: 102 100
Fourth Root of Number of Words: 3.746 4.0
Average Word Length: 4.371 4.6
Word Length SD: 2.478 2.4
No. of Words greater than 5 chars: 52 60
No. of Words greater than 6 chars: 33 50
No. of Words greater than 7 chars: 25 40
No. of Words greater than 8 chars: 15 20
Use of Passive Voice (%): 0 0
Avg. Sentence Length: 19.7 21.0
Sentence Length SD: 6.23 7.5
Use of Discourse Markers (%): 0.7 0.12
Sentence-Text Coherence: 0.438 0.35
Sentence-Para Coherence: 0.658 0.50
Sentence-Sentence Coherence: 0.175 0.07
Number of Paragraphs: 4 4