The graph below shows the quantities of goods transported in the UK between 1974 and 2002 by four different modes of transport.
Summarise the information by selecting and reporting the main features, and make comparisons where relevant.
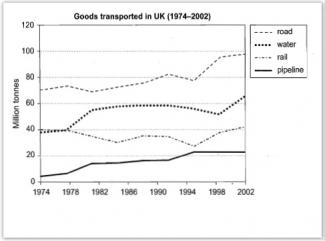
The line graph showed about the data of the quantities of good transported in the UK from 1974 to 2002. The multiple-variable lines were used to show four different modes of transport, such as road, water, rail and pipeline.
In 1974, the graph showed that the higher number of goods transported in UK was using the road by 70 million tonnes, than followed by the use of rail on 40 million tones and by water on 29 million tonnes, than lastly by pipeline on 5 million tonnes.
During twenty eight years, there were some noticeable change from the data. In 2002, the arrangement of modes of transport slightly changed - the used of road and pipeline were the same, but the use of water surpassed the use of rail. In 2002, the use of road dramatically increased to 90 million tonnes. Besides, the use of water also rise significantly to 70 million tonnes. On the other hand, the use of of rail markedly up and downed during 28 years, but in 2002 the use of it was still the same as in 1974 in 40 million tonnes. Still the use of pipeline climbed remarkably to 21 million tonnes.
Generally, the line graph showed that the quantities of goods transported in UK usually used road as the first method to choose, than followed by using of water, rail and lastly pipeline.

some noticeable change
some noticeable changes
Attribute Value Ideal
Score: 6.5 out of 9
Category: Good Excellent
No. of Grammatical Errors: 1 2
No. of Spelling Errors: 0 2
No. of Sentences: 10 10
No. of Words: 229 200
No. of Characters: 1006 1000
No. of Different Words: 93 100
Fourth Root of Number of Words: 3.89 4.0
Average Word Length: 4.393 4.6
Word Length SD: 2.484 2.4
No. of Words greater than 5 chars: 59 60
No. of Words greater than 6 chars: 38 50
No. of Words greater than 7 chars: 26 40
No. of Words greater than 8 chars: 17 20
Use of Passive Voice (%): 0 0
Avg. Sentence Length: 22.9 21.0
Sentence Length SD: 11.811 7.5
Use of Discourse Markers (%): 0.7 0.12
Sentence-Text Coherence: 0.489 0.35
Sentence-Para Coherence: 0.698 0.50
Sentence-Sentence Coherence: 0.178 0.07
Number of Paragraphs: 4 4