The graph illustrates the quantity of chicken, beef, lamb, and fish consumed in a European country between 1979 and 2004.
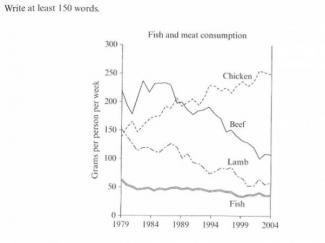
The graph illustrates amount number of chicken, beef, lamb, and fish were consumed in Europe territory, between 1979 to 2004. The information was presented in terms of grams per person per week.
There were two general trends: upward and downward. For the former trend, people in a European country ate chicken less than 150 grams per person per week in 1979. However, this amount number climbed up significantly over the period until reached approximately 250 grams per person per week, in 2004.
According to the downward trend, beef, domestic consumption number started with more than 200 gram...
Subscribe as testbig VIP readers and get unlimited access to essays on the top list.

flaws:
No. of Words: 229 200
Write the essay in 20 minutes.
Attribute Value Ideal
Score: 7.5 out of 9
Category: Very Good Excellent
No. of Grammatical Errors: 0 2
No. of Spelling Errors: 0 2
No. of Sentences: 12 10
No. of Words: 229 200
No. of Characters: 1101 1000
No. of Different Words: 112 100
Fourth Root of Number of Words: 3.89 4.0
Average Word Length: 4.808 4.6
Word Length SD: 2.474 2.4
No. of Words greater than 5 chars: 73 60
No. of Words greater than 6 chars: 46 50
No. of Words greater than 7 chars: 30 40
No. of Words greater than 8 chars: 21 20
Use of Passive Voice (%): 0 0
Avg. Sentence Length: 19.083 21.0
Sentence Length SD: 6.238 7.5
Use of Discourse Markers (%): 0.25 0.12
Sentence-Text Coherence: 0.439 0.35
Sentence-Para Coherence: 0.617 0.50
Sentence-Sentence Coherence: 0.108 0.07
Number of Paragraphs: 4 4