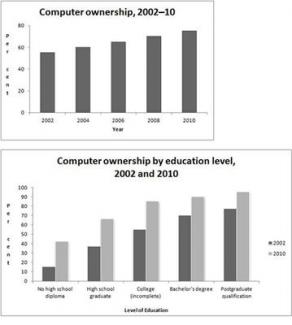
The graphs above give information about computer ownership as a percentage of the population between 2002 and 2010, and by level of education for the years 2002 and 2010.
Summarise the information by selecting and reporting the main features, and make comparisons where relevant.
The bar charts demonstrate data about computer ownership among people with differentiation by level education in percentages in the following years, from 2002 to 2010.
From the first bar chart can be clearly seen that computer ownership steadily increased during eight years since 2002 till 2010, whilst the second graph shows a significant difference of computer ownership by educational level in former years.
Beginning from 2002 computer ownership rose from approximately 56% till nearly 75% in 2010. Compared by years, there was an increase about 4-5% every two years between 2002 and 2010.
Information about computer ownership by educational level shows a considerable distinction in mentioned years. In 2002, population of bachelor’s and postgraduate’s degree in a leading place with around 70%, whereas computer ownership went up to about 90% in these both parts of population in 2010. People without high school diplomas were in the lowest place in the graph, as about 15% and 42% in 2002 and 2010, respectively. There was a great change in indexes of population which graduate high school and not graduate colleges in specified years.

From the first bar chart can be clearly seen that
From the first bar chart it can be clearly seen that
in indexes of population which graduate high school and not graduate colleges in specified years.
in indexes of population which are graduate high school and not graduate colleges in specified years.
Attribute Value Ideal
Score: 6.5 out of 9
Category: Good Excellent
No. of Grammatical Errors: 2 2
No. of Spelling Errors: 0 2
No. of Sentences: 8 10
No. of Words: 181 200
No. of Characters: 941 1000
No. of Different Words: 104 100
Fourth Root of Number of Words: 3.668 4.0
Average Word Length: 5.199 4.6
Word Length SD: 2.912 2.4
No. of Words greater than 5 chars: 62 60
No. of Words greater than 6 chars: 48 50
No. of Words greater than 7 chars: 42 40
No. of Words greater than 8 chars: 29 20
Use of Passive Voice (%): 0 0
Avg. Sentence Length: 22.625 21.0
Sentence Length SD: 7.999 7.5
Use of Discourse Markers (%): 0.25 0.12
Sentence-Text Coherence: 0.499 0.35
Sentence-Para Coherence: 0.711 0.50
Sentence-Sentence Coherence: 0.167 0.07
Number of Paragraphs: 4 4