The pie chart below shows the main reason why agricultural land becomes less productive. The table shows how there causes affected three regions of the world during the 1990s.
Summarise the information by selecting and reporting the main features, and make comparisons where relevant.
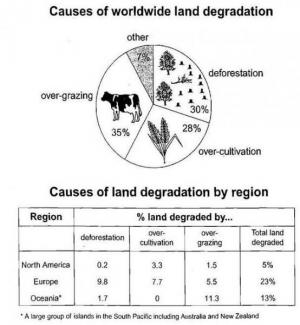
The pie chart gives us information about the primary reasons of worldwide land degradation. The table shows the impact of that degradation on three regions of the world. Both of these are the data during the 1990s.
According to the data on pie chart, the major reason of worldwide degradation is over-grazing by 35%. The second cause of degradation is followed by deforestation on 30% and over-cultivation on 28%. The last is followed by other reasons by 7%.
The data on pie chart can be used to explain the data in the table about the causes of land degradation in some region around the world such as in North America, Europe and Oceania. There are variety reasons of degradation in different regions. In the North America the major reason of degradation is over-cultivation by 33%, in other hand in Europe the major reason of degradation is deforestation by 9.8%, otherwise in Oceania the main reason is over-grazing by 11.3%.
In sum up, we can see from the pie chart that the major reason of agricultural land becoming less productive is caused by over-grazing as the highest percent around the three other reasons. The table provides data about the region having most degraded land is Europe by 23%.

flaws:
1. More content wanted for the table.
2. No. of Different Words: 89 100
----------------------
Attribute Value Ideal
Score: 6.0 out of 9
Category: Good Excellent
No. of Grammatical Errors: 5 2
No. of Spelling Errors: 2 2
No. of Sentences: 11 10
No. of Words: 207 200
No. of Characters: 974 1000
No. of Different Words: 89 100
Fourth Root of Number of Words: 3.793 4.0
Average Word Length: 4.705 4.6
Word Length SD: 2.94 2.4
No. of Words greater than 5 chars: 61 60
No. of Words greater than 6 chars: 43 50
No. of Words greater than 7 chars: 28 40
No. of Words greater than 8 chars: 23 20
Use of Passive Voice (%): 0 0
Avg. Sentence Length: 18.818 21.0
Sentence Length SD: 10.276 7.5
Use of Discourse Markers (%): 0.182 0.12
Sentence-Text Coherence: 0.413 0.35
Sentence-Para Coherence: 0.621 0.50
Sentence-Sentence Coherence: 0.119 0.07
Number of Paragraphs: 4 4